
Mathematics, 15.07.2020 01:01 CoolRahim9090
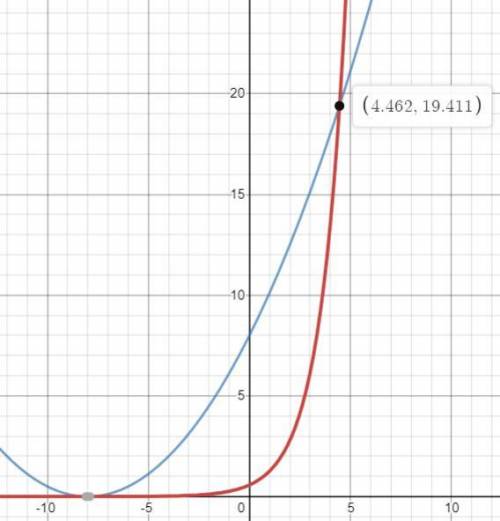
Use the graph to approximate the ordered pair where the exponential function begins to exceed the quadratic function. the graph of an exponential function f of x equals two and two tenths to the power of x minus 7 tenths and a quadratic function g of x equals one eighth times x squared plus 2 times x plus 8

Answers: 3
Another question on Mathematics
Mathematics, 21.06.2019 16:00
Part one: measurements 1. measure your own height and arm span (from finger-tip to finger-tip) in inches. you will likely need some from a parent, guardian, or sibling to get accurate measurements. record your measurements on the "data record" document. use the "data record" to you complete part two of this project. name relationship to student x height in inches y arm span in inches archie dad 72 72 ginelle mom 65 66 sarah sister 64 65 meleah sister 66 3/4 67 rachel sister 53 1/2 53 emily auntie 66 1/2 66 hannah myself 66 1/2 69 part two: representation of data with plots 1. using graphing software of your choice, create a scatter plot of your data. predict the line of best fit, and sketch it on your graph. part three: the line of best fit include your scatter plot and the answers to the following questions in your word processing document 1. 1. which variable did you plot on the x-axis, and which variable did you plot on the y-axis? explain why you assigned the variables in that way. 2. write the equation of the line of best fit using the slope-intercept formula $y = mx + b$. show all your work, including the points used to determine the slope and how the equation was determined. 3. what does the slope of the line represent within the context of your graph? what does the y-intercept represent? 5. use the line of best fit to you to describe the data correlation.
Answers: 2
Mathematics, 21.06.2019 21:30
The measures of the legs of a right triangle are 15m and 20m . what is the length of the hypotenuse
Answers: 1
Mathematics, 21.06.2019 21:50
Rachel is studying the population of a particular bird species in a national park. she observes every 10th bird of that species that she can find in the park. her conclusion is that the birds living in the park who belong to that species generally feed on insects. rachel's sample is . based on the sample she picked, rachel's generalization is . reset next
Answers: 1
You know the right answer?
Use the graph to approximate the ordered pair where the exponential function begins to exceed the qu...
Questions

History, 27.06.2019 04:30


Mathematics, 27.06.2019 04:30
Biology, 27.06.2019 04:30

Mathematics, 27.06.2019 04:30
History, 27.06.2019 04:30

Mathematics, 27.06.2019 04:30

Chemistry, 27.06.2019 04:30


