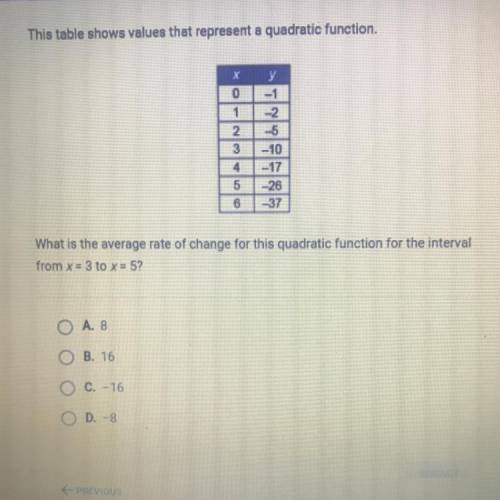
This table shows values that represent a quadratic function.
x
0
1
2
3
4
5
6
y
--1
-2
5
-10
-17
-26
-37
What is the average rate of change for this quadratic function for the interval
from x = 3 to x = 5?
A. 8
B. 16
O C. -16
c
D. 8
Angela took a general public aptitude test and scored in the 88th percentile for aptitude in accounting. what percentage of the scores were at or below her score?