
Mathematics, 08.07.2020 09:01 gingerham1
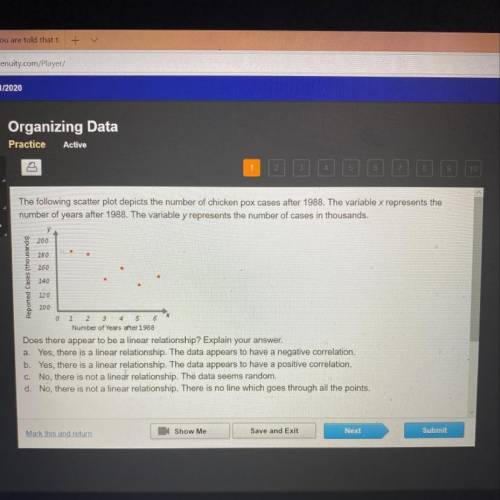
The following scatter plot depicts the number of chicken pox cases after 1988. The variable x represents the
number of years after 1988. The variable y represents the number of cases in thousands.
200
280
260
Reported Cases (thousands)
140
220
4
200
0 2 2 3 5 6
Number of years after 1988
Does there appear to be a linear relationship? Explain your answer.
a. Yes, there is a linear relationship. The data appears to have a negative correlation.
b. Yes, there is a linear relationship. The data appears to have a positive correlation.
C. No, there is not a linear relationship. The data seems random.
d. No, there is not a linear relationship. There is no line which goes through all the points.

Answers: 1
Another question on Mathematics
Mathematics, 21.06.2019 19:30
If (17, 4) is an ordered pair of the inverse of f(x), which of the following is an ordered pair of the function f(x)? a. (17,4) b. (4.17) c. (4,0) d. 0,17)
Answers: 2
Mathematics, 21.06.2019 20:50
What is the greatest number of parts of a circle that can be formed by cutting the circle with 7 straight cuts? (note: the parts do not have to be equal in size)
Answers: 3
Mathematics, 21.06.2019 23:30
The complement of an angle is one-sixth the measure of the supplement of the angle. what is the measure of the complement angle?
Answers: 3
You know the right answer?
The following scatter plot depicts the number of chicken pox cases after 1988. The variable x repres...
Questions


Biology, 21.10.2020 21:01
Biology, 21.10.2020 21:01

Mathematics, 21.10.2020 21:01


Chemistry, 21.10.2020 21:01
Mathematics, 21.10.2020 21:01
Mathematics, 21.10.2020 21:01
Mathematics, 21.10.2020 21:01
Social Studies, 21.10.2020 21:01
Mathematics, 21.10.2020 21:01


Mathematics, 21.10.2020 21:01


