
Mathematics, 04.07.2020 21:01 kprincess16r
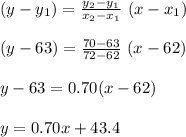
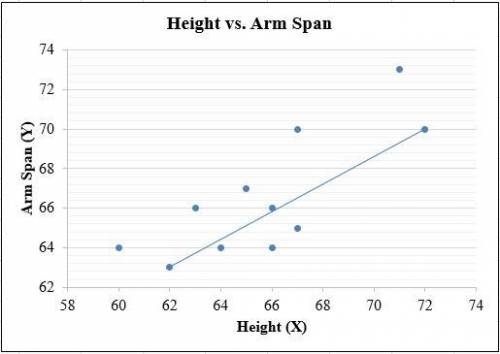
There are many measurements of the human body that are positively correlated. For example, the length of one's forearm (measured from elbow to wrist) is approximately the same length as the foot (measured from heel to toe). They are positively correlated because, as one measurement increases, so does the other measurement. You will discover through this project whether a human's arm span (measured across the body with the arms extended) is correlated to his height. You will need to collect data from 11 people, which will give you 12 data points including your own personal data. You will turn in and answer questions regarding only one scatter plot if doing the project alone. Part One: Measurements 1Measure your own height and arm span (from finger-tip to finger-tip) in inches. You will likely need some help from a parent, guardian, or sibling to get accurate measurements. Record your measurements on the "Data Record" document. Use the "Data Record " to help you complete Part Two of this project. 2Measure 11 additional people, and record their arm spans and heights in inches. Part Two: Representation of Data with Plots 1Using graphing software of your choice, create a scatter plot of your data. Predict the line of best fit, and sketch it on your graph. 2Copy and paste your scatter plot into a word processing document. Part Three: The Line of Best Fit Include your scatter plot and the answers to the following questions in your word processing document. 1Which variable did you plot on the x-axis, and which variable did you plot on the y-axis? Explain why you assigned the variables in that way. 2Write the equation of the line of best fit using the slope-intercept formula $y = mx + b$. Show all your work, including the points used to determine the slope and how the equation was determined. 3What does the slope of the line represent within the context of your graph? What does the y-intercept represent? 4Test the residuals of two other points to determine how well the line of best fit models the data. 5Use the line of best fit to help you to describe the data correlation. 6Using the line of best fit that you found in Part Three, Question 2, approximate how tall is a person whose arm span is 66 inches? 7According to your line of best fit, what is the arm span of a 74-inch-tall person?

Answers: 1
Another question on Mathematics
Mathematics, 21.06.2019 13:50
What are the vertical asymptotes of the function f(x) =5x+5/x2 + x-2
Answers: 1
Mathematics, 21.06.2019 14:20
Factor p 2 + 18p + 32. (p+ 4)(p + 8) (p + 2)p+ 16) (p + 16)2
Answers: 1
Mathematics, 21.06.2019 15:00
Which statement is always true? a. square bcdf is a rectangle. b. rectangle gjkm is a square. c. quadrilateral stpr is a trapezoid. d. parallelogram abcd is a rhombus.
Answers: 2
Mathematics, 21.06.2019 16:30
International calls require the use of a country code. many country codes a 3-digit numbers. country codes do not begin with a 0 or 1. there are no restrictions on the second and third digits. how many different 3-digit country codes are possible?
Answers: 2
You know the right answer?
There are many measurements of the human body that are positively correlated. For example, the lengt...
Questions

Mathematics, 02.02.2022 15:50

Mathematics, 02.02.2022 15:50
Mathematics, 02.02.2022 15:50

Computers and Technology, 02.02.2022 16:00

Social Studies, 02.02.2022 16:00
SAT, 02.02.2022 16:00
SAT, 02.02.2022 16:00

Chemistry, 02.02.2022 16:00


