
Mathematics, 03.07.2020 23:01 dondre54
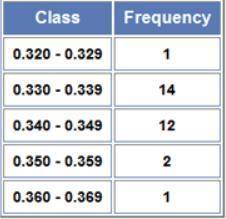
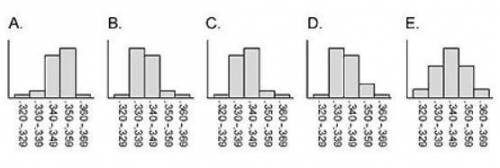
Here are 30 best lifetime baseball batting averages of all time is shown to the right. These data can be graphically displayed as a histogram. Which of the following graphs correctly displays the data from the table? A. Graph A B. Graph B C. Graph C D. Graph D E. Graph E

Answers: 1
Another question on Mathematics
Mathematics, 21.06.2019 20:30
Find the value of x. give reasons to justify your solutions! c ∈ ae
Answers: 1
Mathematics, 21.06.2019 21:00
X+y=-4 x-y=2 use elimination with adding and subtraction
Answers: 3
Mathematics, 21.06.2019 21:40
Use sigma notation to represent the following series for 9 terms.
Answers: 2
You know the right answer?
Here are 30 best lifetime baseball batting averages of all time is shown to the right. These data ca...
Questions

Mathematics, 23.09.2019 20:00
Mathematics, 23.09.2019 20:00

Business, 23.09.2019 20:00


Biology, 23.09.2019 20:00
Social Studies, 23.09.2019 20:00

Mathematics, 23.09.2019 20:00
History, 23.09.2019 20:00
History, 23.09.2019 20:00
Mathematics, 23.09.2019 20:00


