
Mathematics, 02.07.2020 17:01 rollercoasterbuddies
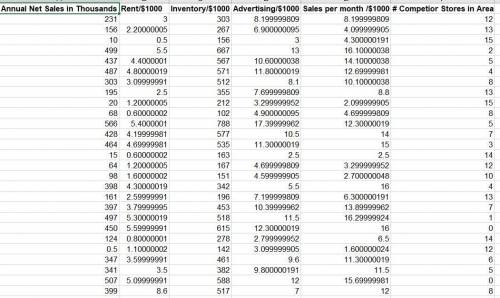
You are thinking about opening up a Starbucks in your area but what to know if it is a good investment. How much money do Starbucks actually make in a year? You collect data to, to help estimate Annual Net Sales, in thousands, of dollars to know how much money you will be making. You collect data on 27 stores to help make your decision. x1 = Rent in Thousand per month x2 = Amount spent on Inventory in Thousand per month x3 = Amount spent on Advertising in Thousand per month x4 = Sales in Thousand per month x5= How many Competitors stores are in the Area Find the estimated regression equation which can be used to estimate Annual Net Sales when using these 5 variables are predictor variables. See Attached Excel for Data.\

Answers: 1
Another question on Mathematics
Mathematics, 21.06.2019 16:00
Part one: measurements 1. measure your own height and arm span (from finger-tip to finger-tip) in inches. you will likely need some from a parent, guardian, or sibling to get accurate measurements. record your measurements on the "data record" document. use the "data record" to you complete part two of this project. name relationship to student x height in inches y arm span in inches archie dad 72 72 ginelle mom 65 66 sarah sister 64 65 meleah sister 66 3/4 67 rachel sister 53 1/2 53 emily auntie 66 1/2 66 hannah myself 66 1/2 69 part two: representation of data with plots 1. using graphing software of your choice, create a scatter plot of your data. predict the line of best fit, and sketch it on your graph. part three: the line of best fit include your scatter plot and the answers to the following questions in your word processing document 1. 1. which variable did you plot on the x-axis, and which variable did you plot on the y-axis? explain why you assigned the variables in that way. 2. write the equation of the line of best fit using the slope-intercept formula $y = mx + b$. show all your work, including the points used to determine the slope and how the equation was determined. 3. what does the slope of the line represent within the context of your graph? what does the y-intercept represent? 5. use the line of best fit to you to describe the data correlation.
Answers: 2
Mathematics, 21.06.2019 18:00
Describe the relationship between the angles of similar triangles and the sides of similar triangles
Answers: 1
Mathematics, 21.06.2019 20:30
Secant be and cf intersect at point d inside a what is the measure of cde
Answers: 1
You know the right answer?
You are thinking about opening up a Starbucks in your area but what to know if it is a good investme...
Questions


Social Studies, 10.05.2021 19:40


English, 10.05.2021 19:40


Arts, 10.05.2021 19:40
Mathematics, 10.05.2021 19:40
Mathematics, 10.05.2021 19:40

Mathematics, 10.05.2021 19:40

Computers and Technology, 10.05.2021 19:40
Mathematics, 10.05.2021 19:40
English, 10.05.2021 19:40


