
Mathematics, 01.07.2020 15:01 asims13
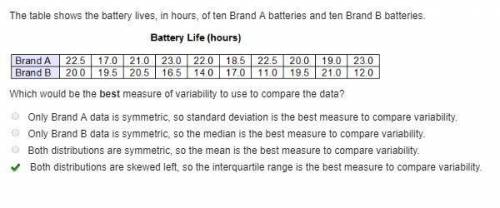
The table shows the battery lives, in hours, of ten Brand A batteries and ten Brand B batteries.
Battery Life (hours)
Brand A
Brand B
22.5 17.0 21.0 23.0 22.0 18.5 22.5 20.0 19.0
20.0 19.5 20.5 16.5 14.0 17.0 11.0 19.5 21.0
23.0
12.0
Which would be the best measure of variability to use to compare the data?
Only Brand A data is symmetric, so standard deviation is the best measure to compare variability.
Only Brand B data is symmetric, so the median is the best measure to compare variability.
Both distributions are symmetric, so the mean is the best measure to compare variability.
Both distributions are skewed left, so the interquartile range is the best measure to compare variability

Answers: 3
Another question on Mathematics
Mathematics, 21.06.2019 18:40
Christina can paint 420 square feet in 105 minutes. which unit rate describes the scenario?
Answers: 1
Mathematics, 21.06.2019 19:30
Look at this pattern ; 1,4,9, number 10000 belongs in this pattern . what’s the place of this number?
Answers: 3
Mathematics, 21.06.2019 19:40
If w = 6 units, x = 3 units, and y = 5 units, what is the surface area of the figure? 168 units2 240 units2 144 units2 96 units2
Answers: 1
You know the right answer?
The table shows the battery lives, in hours, of ten Brand A batteries and ten Brand B batteries.
Ba...
Questions


Social Studies, 27.06.2019 04:30

Computers and Technology, 27.06.2019 04:30


Biology, 27.06.2019 04:30
Computers and Technology, 27.06.2019 04:30
Computers and Technology, 27.06.2019 04:30
Computers and Technology, 27.06.2019 04:30
Biology, 27.06.2019 04:30
Mathematics, 27.06.2019 04:30
Mathematics, 27.06.2019 04:30

Health, 27.06.2019 04:30


