
Mathematics, 01.07.2020 16:01 breadwonders3738
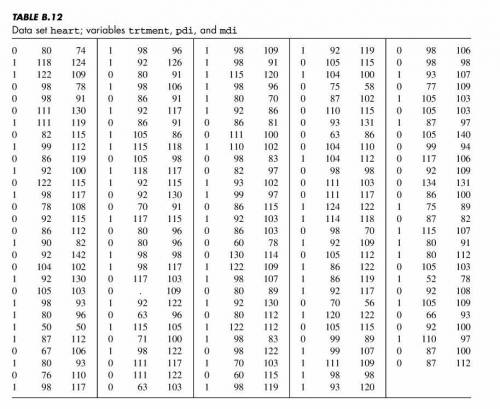
The Bayley Scales of Infant Development yield scores on two indices--the Psychomotor Development Index (PDI) and the Mental Development Index (MDI)--which can be use to assess a child's level of functioning in each of these areas at approximately one year of age. Among normal healthy infants, both indices have a mean value of 100. As part of a study assessing the development and neurologic status of children who have undergone reparative heart surgery during the first three months of life, the Bayley Scales were administered to a sample of one-year-old infants with congenital heart disease. The data contained in the data set heart. PDI scores are saved under the variable name pdi while MDI scores are saved under mdi. Use the treatment=1 group
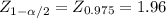
a. At the 0.05 level of significance, test the null hypothesis that the mean PDI score for children born with congenital heart disease who undergo reparative heart surgery during the first three months of life is equal to 100, the mean score for healthy children. Use a two-sided test. What is the p-value? What do you conclude?
b. Conduct the analogous test of hypothesis for the mean MDI score. What do you conclude?
c. Construct 95% confidence intervals for the true mean PDI score and the true mean MDI score for this population of children with congenital heart disease. Does either of these intervals contain 100? Would you have expected that they would?

Answers: 1
![Z= \frac{X[bar]_1-Mu_1}{\frac{S_1}{\sqrt{n_1} } }](/tpl/images/0698/9561/a42de.png) ≈N(0;1)
≈N(0;1)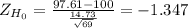
![Z= \frac{X[bar]_2-Mu_2}{\frac{S_2}{\sqrt{n_2} } }](/tpl/images/0698/9561/43b29.png) ≈N(0;1)
≈N(0;1)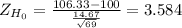
 *
* 


Another question on Mathematics
Mathematics, 21.06.2019 18:50
Find the center and the radius of the circle with the equation: x^2-2x+y^2+4y+1=0?
Answers: 1
Mathematics, 21.06.2019 19:00
Write an introductory paragraph for this corrie ten boom and her family were faced with some difficult choices after hitler came to power. some family members paid the ultimate price. write a carefully thought-out paper of at least 200 words dealing with the following concepts: --how should a christian act when evil is in power? --what do you think it would be like to live in an occupied country? remember to proofread anything you write thoroughly.
Answers: 1
Mathematics, 21.06.2019 20:00
Choose the linear inequality that describes the graph. the gray area represents the shaded region. a: y ≤ –4x – 2 b: y > –4x – 2 c: y ≥ –4x – 2 d: y < 4x – 2
Answers: 2
Mathematics, 22.06.2019 00:30
Which equation could represent the relationship shown in the scatter plot? y=−3x−2 y=−3/4x+10 y=−2/3x+1 y=9x−12 scatter plot with x axis labeled variable x and y axis labeled variable y. points go from upper left to lower right.
Answers: 1
You know the right answer?
The Bayley Scales of Infant Development yield scores on two indices--the Psychomotor Development Ind...
Questions


