
Mathematics, 30.06.2020 07:01 maciemessing2
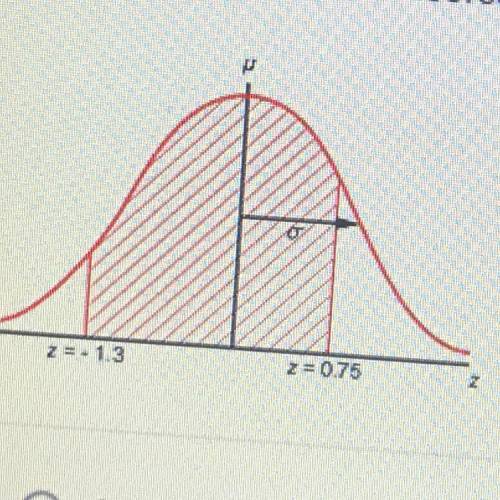
The standard normal curve shown below models the population distribution
of a random variable. What proportion of the values in the population does
not lie between the two z-scores indicated on the diagram?
u
2.1.3
20.75
A. 0.3025
B. 0.3148
C. 0.3097
D. 0.3310
E. 0.3234

Answers: 3
Another question on Mathematics
Mathematics, 21.06.2019 15:30
Suppose you want just guess at the answers in a 5 question multiple-choice test. each question has 3 responses and only one is correct. what is the probability of getting two questions right just guessing? 20 points 0.3275 0.2753 0.7532 none of the above
Answers: 3
Mathematics, 21.06.2019 18:30
School has 204 sixth grade students. if the sixth grade is 30% of the total school, how many students are in the middle school?
Answers: 2
Mathematics, 21.06.2019 18:40
2people are trying different phones to see which one has the better talk time. chatlong has an average of 18 hours with a standard deviation of 2 hours and talk-a-lot has an average of 20 hours with a standard deviation of 3. the two people who tested their phones both got 20 hours of use on their phones. for the z-scores i got 1 for the chatlong company and 0 for talk-a-lot. what is the percentile for each z-score?
Answers: 1
Mathematics, 21.06.2019 19:30
Prove the divisibility of the following numbers: 25^9 + 5^7 is divisible by 30.also, read as (25 to the power of 9) + (5 to the power of 7) is divisible by 30. blank x 30what is the blank? ( it should be expressed in exponent form)
Answers: 1
You know the right answer?
The standard normal curve shown below models the population distribution
of a random variable. What...
Questions

Biology, 29.09.2020 04:01
Mathematics, 29.09.2020 04:01

Engineering, 29.09.2020 04:01

Arts, 29.09.2020 04:01

Physics, 29.09.2020 04:01
Mathematics, 29.09.2020 04:01

Mathematics, 29.09.2020 04:01
Biology, 29.09.2020 04:01

World Languages, 29.09.2020 04:01

Mathematics, 29.09.2020 04:01
Mathematics, 29.09.2020 04:01
Mathematics, 29.09.2020 04:01


