
Mathematics, 28.06.2020 15:01 jaejaeJae9534
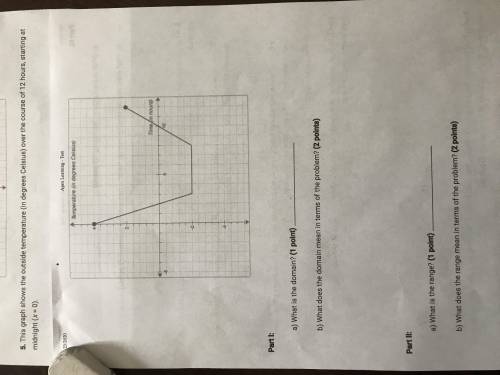
PLS Help me! This graph shows the outside temperature (in degrees Celsius) over the course of 12 hours, starting at midnight (x = 0). What is the domain? What does the domain mean in terms of the problem? What is the range? What does the range mean in terms of the problem? When is the function decreasing? What does this decreasing interval mean in terms of the problem?

Answers: 3
Another question on Mathematics
Mathematics, 21.06.2019 16:00
Part one: measurements 1. measure your own height and arm span (from finger-tip to finger-tip) in inches. you will likely need some from a parent, guardian, or sibling to get accurate measurements. record your measurements on the "data record" document. use the "data record" to you complete part two of this project. name relationship to student x height in inches y arm span in inches archie dad 72 72 ginelle mom 65 66 sarah sister 64 65 meleah sister 66 3/4 67 rachel sister 53 1/2 53 emily auntie 66 1/2 66 hannah myself 66 1/2 69 part two: representation of data with plots 1. using graphing software of your choice, create a scatter plot of your data. predict the line of best fit, and sketch it on your graph. part three: the line of best fit include your scatter plot and the answers to the following questions in your word processing document 1. 1. which variable did you plot on the x-axis, and which variable did you plot on the y-axis? explain why you assigned the variables in that way. 2. write the equation of the line of best fit using the slope-intercept formula $y = mx + b$. show all your work, including the points used to determine the slope and how the equation was determined. 3. what does the slope of the line represent within the context of your graph? what does the y-intercept represent? 5. use the line of best fit to you to describe the data correlation.
Answers: 2
Mathematics, 21.06.2019 18:30
What is coefficient of the term of degree of degree 5 in the polynomial below
Answers: 1
Mathematics, 21.06.2019 21:30
He ! a group of farmers planned to clean 80 acres of wheat per day to finish the work on schedule. right before the work started, they received a new piece of machinery that them clean 10 more acres per day than originally planned. as a result of increased productivity in the last day before the deadline they only had to clean 30 acres. how many acres of wheat did the group of farmers have to clean?
Answers: 1
You know the right answer?
PLS Help me! This graph shows the outside temperature (in degrees Celsius) over the course of 12 hou...
Questions
Mathematics, 31.07.2019 13:20
Mathematics, 31.07.2019 13:20
Mathematics, 31.07.2019 13:20

Business, 31.07.2019 13:20

Biology, 31.07.2019 13:20
Biology, 31.07.2019 13:20


Social Studies, 31.07.2019 13:20
Biology, 31.07.2019 13:20
History, 31.07.2019 13:20
History, 31.07.2019 13:20
History, 31.07.2019 13:20
Biology, 31.07.2019 13:20

Physics, 31.07.2019 13:20


