
Mathematics, 26.06.2020 15:01 carcamophillip
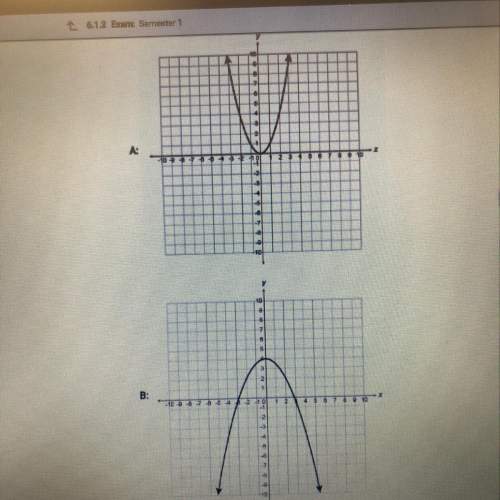
Which graph represents the function f(x) = log10(x) − 2? (1 point) logarithmic function passing through point 3, 0. logarithmic function passing through point negative 1, 0. logarithmic function passing through point 1, 2. logarithmic function passing through point 1, negative 2.

Answers: 1
Another question on Mathematics
Mathematics, 21.06.2019 19:30
The table below represents the displacement of a fish from its reef as a function of time: time (hours) x displacement from reef (feet) y 0 4 1 64 2 124 3 184 4 244 part a: what is the y-intercept of the function, and what does this tell you about the fish? (4 points) part b: calculate the average rate of change of the function represented by the table between x = 1 to x = 3 hours, and tell what the average rate represents. (4 points) part c: what would be the domain of the function if the fish continued to swim at this rate until it traveled 724 feet from the reef? (2 points)
Answers: 2
Mathematics, 21.06.2019 21:30
Look at the figure below: triangle abc is a right triangle with angle abc equal to 90 degrees. the length of ac is 5 units and the length of ab is 4 units. d is a point above c. triangle adc is a right triangle with angle dac equal to 90 degrees and dc parallel to ab. what is the length, in units, of segment cd?
Answers: 1
Mathematics, 21.06.2019 23:30
Alex's monthly take home pay is $2,500. what is the maximum bad debt payment he can maintain without being in credit overload?
Answers: 2
You know the right answer?
Which graph represents the function f(x) = log10(x) − 2? (1 point) logarithmic function passing thro...
Questions


History, 11.03.2020 17:05


