
Mathematics, 23.06.2020 10:57 puppy4151
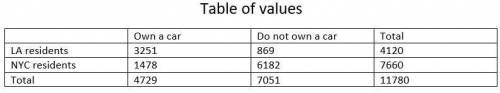
A survey was taken of a random sampling of residents of New York City and Los Angeles to compare how many of them own a car. A 4-column table with 3 rows. The first column has no label with entries L A residents, N Y C residents, total. The second column is labeled own a car with entries 3,251; 1,478, 4,729. The third column is labeled do not own a car with entries 869; 6,182; 7,051. The fourth column is labeled total with entries 4,120; 7,660; 11,780. Which statement about the two-way frequency table is true? The survey represents quantitative data. There is a greater percentage of LA residents who own a car than NYC residents who do. The total number of people in the poll who own a car is 4,120. More people in the poll own a car than do not own a car.

Answers: 3
Another question on Mathematics
Mathematics, 21.06.2019 14:30
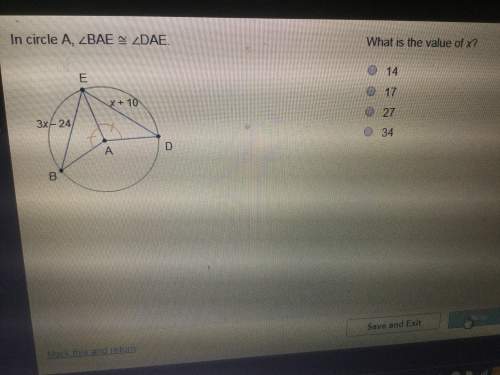
What is the value of x? enter your answer in the box. (cm)
Answers: 1
Mathematics, 21.06.2019 17:30
Sheila wants to bake six muffins but the recipe is for 12 muffins . this means you only need half of the ingredients listed how much of the of each ingredient does she need? one cup and banana chips ,7 tablespoons oil , two eggs, 3/4 cups flour 1/4 cup walnuts show all you work and justify your answer using a baby toulmin.
Answers: 3
Mathematics, 21.06.2019 18:30
For this option, you will work individually. the pythagorean theorem can be used in many real-world scenarios. part 1 write your own real-world scenario where the pythagorean theorem can be applied to find a missing piece. you may choose to write a problem that is two- or three-dimensional in nature. be sure that you will be able to draw a diagram of your scenario. write out your problem and submit it for part 1. be sure to end your scenario with a question. part 2 draw a diagram of the scenario you created in part 1. you may draw by hand and scan and upload your drawing or create a computer-generated drawing for submission. be sure to label all parts and dimensions of the drawing. part 3 solve the question that you posed in part 1. show all of your steps in answering the question. for this option, you will need to submit all three parts for full credit—your real-world problem and question, the diagram that you created, and your work solving the problem, showing all steps. * note that your instructor is looking for your own original idea. while it is acceptable to use the internet for research and inspiration, academic integrity policies apply.
Answers: 1
Mathematics, 21.06.2019 22:00
The two box p digram the two box plots show the data of the pitches thrown by two pitchers throughout the season. which statement is correct? check all that apply. pitcher 1 has a symmetric data set. pitcher 1 does not have a symmetric data set. pitcher 2 has a symmetric data set. pitcher 2 does not have a symmetric data set. pitcher 2 has the greater variation.ots represent the total number of touchdowns two quarterbacks threw in 10 seasons of play
Answers: 1
You know the right answer?
A survey was taken of a random sampling of residents of New York City and Los Angeles to compare how...
Questions

History, 21.06.2019 19:10

English, 21.06.2019 19:10
Mathematics, 21.06.2019 19:10
Mathematics, 21.06.2019 19:10


Mathematics, 21.06.2019 19:10
English, 21.06.2019 19:10


