
Mathematics, 11.06.2020 01:57 breannaasmith1122
The accompanying data represent the total travel tax (in dollars) for a 3-day business trip in 8 randomly selected cities A normal probability plot suggests the data could come from a population that is normally distributed. A boxplot indicates there are no outliers. Complete parts through below.
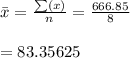
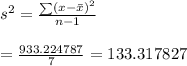
68.87 78.25 70.44 84.67 79.79 86.33 100.24 98.26
Click the icon to view the table of critical t-values.
a. Determine a point estimate for the population mean travel tax A point estimate for the population mean travel tax is $ 83.36. (Round to two decimal places as needed.)
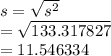
b. Construct and interpret a 95% confidence interval for the mean tax paid for a three-day business trip.
Select the correct choice below and fill in the answer boxes to complete your choice. (Round to two decimal places as needed.)
A. The lower bound is $ and the upper bound is $. One can be % confident that all cities have a travel tax between these values.
B. The lower bound is $ and the upper bound is $ The travel tax is between these values for % of all cities.
C. The lower bound is $ and the upper bound is $ There is a % probability that the mean travel tax for all cities is between these values.
D. The lower bound is $ and the upper bound is One can be [95]% confident that the mean travel tax for all cities is between these values.
c. What would you recommend to a researcher who wants to increase the precision of the interval, but does not have access to additional data?
A. The researcher could decrease the level of confidence.
B. The researcher could decrease the sample standard deviation.
C. The researcher could increase the level of confidence.
D. The researcher could increase the sample mean

Answers: 2
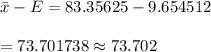
 using t - dist
 ( from t - table , two tails, d.f =7)
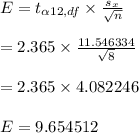


Another question on Mathematics
Mathematics, 21.06.2019 12:30
The total number of photos on hannah’s camera is a linear function of how long she was in rome. she already had 44 photos on her camera when she arrived. then she took 24 photos each day for 6 days. what is the rate of change of the linear function that represents this
Answers: 1
Mathematics, 21.06.2019 15:30
Look at the following graph of the given equation. determine whether the equation is a function. explain why or why not.
Answers: 1
You know the right answer?
The accompanying data represent the total travel tax (in dollars) for a 3-day business trip in 8 ran...
Questions
Mathematics, 29.05.2020 20:05

Mathematics, 29.05.2020 20:05

History, 29.05.2020 20:05

Mathematics, 29.05.2020 20:05
Mathematics, 29.05.2020 20:05

Social Studies, 29.05.2020 20:05

Business, 29.05.2020 20:05

Social Studies, 29.05.2020 20:05

Physics, 29.05.2020 20:05
Mathematics, 29.05.2020 20:05


