
Mathematics, 10.06.2020 01:57 kendrabrown41
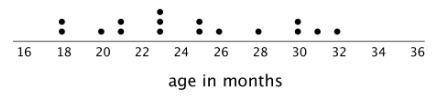
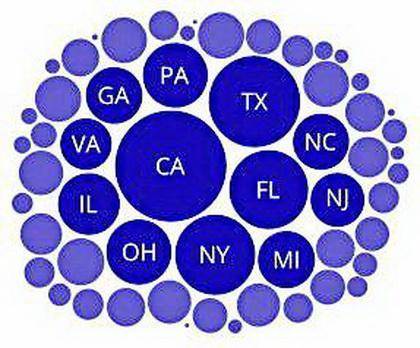
Noah gathered information on the home states of the swimmers on Team USA. He organized the data in a table. Would a dot plot be appropriate to display his data? Explain your reasoning. This dot plot shows the ages of students in a swimming class. How many students are in the class?
Based on the dot plot, do you agree with each of the following statements? Explain your reasoning.
The class is an adult swimming class.
Half of the students are between 2 and 3 years old.

Answers: 2
Another question on Mathematics
Mathematics, 21.06.2019 15:00
In a circle, a 45° sector has an area of 32π cm2. what is the radius of this circle? 32 cm 12 cm 16 cm 8 cm
Answers: 3
Mathematics, 21.06.2019 19:00
What are the solutions of the equation? 16x^2 + 24x + 5 = 5 a. 1/4, 5/4 b. -1/4, -5/4 c. -1/4, 5/4 d. 1/4 , -5/4
Answers: 1
Mathematics, 21.06.2019 19:30
Last month, a 770 g box of cereal was sold at a grocery store for $3.10. however, this month, the cereal manufacturer launched the same cereal in a 640 g box, which is being sold at $2.50. what is the percent change in the unit price?
Answers: 1
You know the right answer?
Noah gathered information on the home states of the swimmers on Team USA. He organized the data in a...
Questions

Mathematics, 04.01.2021 22:50


Chemistry, 04.01.2021 22:50
Mathematics, 04.01.2021 22:50

Mathematics, 04.01.2021 22:50
Mathematics, 04.01.2021 22:50
History, 04.01.2021 22:50


