You will find the answer from my explanation.
Step-by-step explanation:
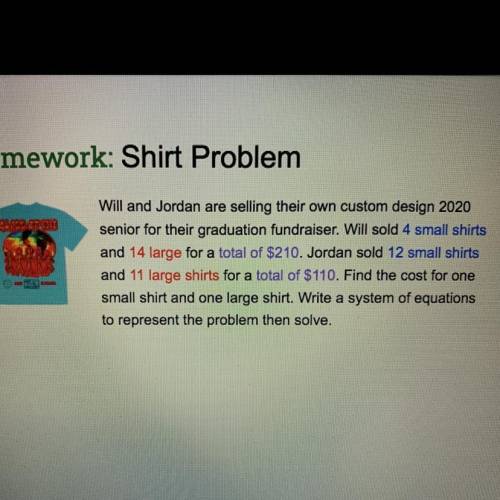
Let the cost of one small shirt be x
And that of a large shirt be y
From the expression above;
4x + 14y = 210; since the total cost of a small shirt by Wili is;
4 * x and the large shirts 14 * y
Similarly for Jordan we have:
12x + 11y = 110; since the total cost of a small shirt by Jordan is;
12 * x and the large shirts 11 * y
We now have two equations,
So you can solve both equations now using elimination method;
If you multiply all the variables of x and y in the first equation by 3 and then subtract the second equation from it, x would be eliminated remaining y;
Multiplying the first equation we have;
12x + 42y = 630
- 12x + 11y = 110
0. + 31y = 520
You can continue from there