Use the interactive number line to graph the inequality x > –2.5.
Which statements ar...

Mathematics, 27.05.2020 23:59 shradhwaip2426
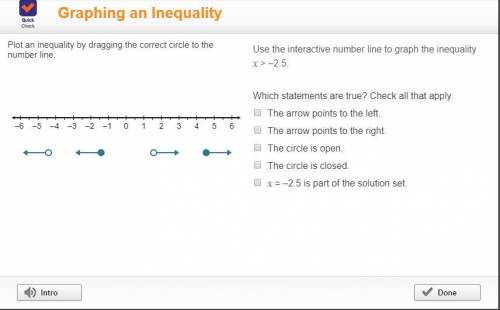
Use the interactive number line to graph the inequality x > –2.5.
Which statements are true? Check all that apply.
The arrow points to the left.
The arrow points to the right.
The circle is open.
The circle is closed.
x = –2.5 is part of the solution set.

Answers: 3
Another question on Mathematics
Mathematics, 21.06.2019 23:00
How many 3-digit numbers can you write using only digits 1 and 7? (of course, digits can repeat.) how many 3-digit numbers can you write using only digits 1 and 7? (of course, digits can repeat.)
Answers: 2
Mathematics, 22.06.2019 01:30
The box plots show the distributions of the numbers of words per line in an essay printed in two different fonts.which measure of center would be best to compare the data sets? the median is the best measure because both distributions are left-skewed.the mean is the best measure because both distributions are left-skewed.the median is the best measure because both distributions are symmetric.the mean is the best measure because both distributions are symmetric
Answers: 1
Mathematics, 22.06.2019 02:00
Aiko jumped rope for 20 min and stopped at 8: 05 when did she start
Answers: 1
You know the right answer?
Questions
Mathematics, 06.07.2019 16:10


Mathematics, 06.07.2019 16:20

History, 06.07.2019 16:20

Computers and Technology, 06.07.2019 16:20
Health, 06.07.2019 16:20


