
Mathematics, 28.05.2020 23:04 mackdoolittle1
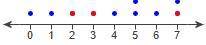
The mean of the data set is 4. Find the absolute deviation of each the red data values. The absolute value of 2 is _.
I uploaded the graph on the question.

Answers: 2
Another question on Mathematics
Mathematics, 21.06.2019 17:20
Which system of linear inequalities is represented by the graph? + l tv x-3y > 6 and y > 2x o x + 3y > 6 and y o x-3y > 6 and y> 2x o x + 3y > 6 and y > 2x + 4 la +
Answers: 1
Mathematics, 21.06.2019 18:40
A33 gram sample of a substance that's used to detect explosives has a k-value of 0.1473. n = noekt no = initial mass (at time t = 0) n = mass at time t k = a positive constant that depends on the substance itself and on the units used to measure time t = time, in days
Answers: 1
Mathematics, 21.06.2019 18:40
That table shows measurements (in invhes$ from cubes with different side lengths. which pairs of variables have a linear relationship? check all that apply
Answers: 3
Mathematics, 21.06.2019 20:30
2. explain in words how you plot the point (4, −2) in a rectangular coordinate system.
Answers: 1
You know the right answer?
The mean of the data set is 4. Find the absolute deviation of each the red data values. The absolute...
Questions

Mathematics, 20.09.2021 14:00

History, 20.09.2021 14:00
Mathematics, 20.09.2021 14:00
Biology, 20.09.2021 14:00

Mathematics, 20.09.2021 14:00
Social Studies, 20.09.2021 14:00
Mathematics, 20.09.2021 14:00
Biology, 20.09.2021 14:00

Mathematics, 20.09.2021 14:00

English, 20.09.2021 14:00


