
Mathematics, 28.05.2020 22:05 keilyn80
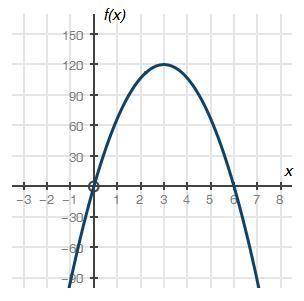
Please answer asap The graph below shows a company's profit f(x), in dollars, depending on the price of pens x, in dollars, sold by the company:
Graph of quadratic function f of x having x intercepts at ordered pairs 0, 0 and 6, 0. The vertex is at 3, 120.
Part A: What do the x-intercepts and maximum value of the graph represent? What are the intervals where the function is increasing and decreasing, and what do they represent about the sale and profit? (4 points)
Part B: What is an approximate average rate of change of the graph from x = 3 to x = 5, and what does this rate represent? (3 points)
Part C: Describe the constraints of the domain. (3 points)

Answers: 1
Another question on Mathematics
Mathematics, 21.06.2019 16:30
Anyone know? is appreciated! will mark brainliest if correct!
Answers: 2
Mathematics, 21.06.2019 17:30
One integer is 8 times another. if the product is 72, then find the integers
Answers: 2
Mathematics, 21.06.2019 19:30
Factor the polynomial 4x4 – 20x2 – 3x2 + 15 by grouping. what is the resulting expression? (4x2 + 3)(x2 – 5) (4x2 – 3)(x2 – 5) (4x2 – 5)(x2 + 3) (4x2 + 5)(x2 – 3)
Answers: 1
You know the right answer?
Please answer asap The graph below shows a company's profit f(x), in dollars, depending on the price...
Questions

Mathematics, 19.07.2019 10:50

History, 19.07.2019 10:50

Advanced Placement (AP), 19.07.2019 10:50

Physics, 19.07.2019 10:50
History, 19.07.2019 10:50


