Ms. Cebrera counted the number of absences each student in her class had last year.
She record...

Mathematics, 27.05.2020 17:59 esmeraldavelez63
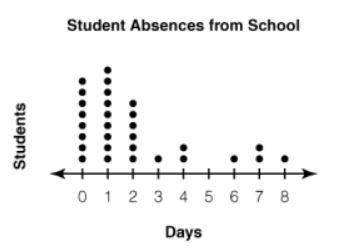
Ms. Cebrera counted the number of absences each student in her class had last year.
She recorded the results on the dot plot below.
Dot plot named as ALTDCStudent Absences from SchoolALTDC has number line from 0 to 8. 8 dots on 0, 9 dots on 1, 6 dots on 2, 1 dot on 3, 2 dots on 4, 1 dot on 6, 2 dots on 7 and 1 dot on 8 is given.
Which statement best describes the shape of the data?
A.
pulled to the left
B.
pulled to the right
C.
symmetric
D.
no noticeable shape

Answers: 2
Another question on Mathematics
Mathematics, 21.06.2019 16:30
Hi my sisters and brothers can tell me the answer because i don’t understand the question
Answers: 1
Mathematics, 21.06.2019 21:00
M.xyz =radians. covert this radian measure to its equivalent measure in degrees.
Answers: 1
Mathematics, 22.06.2019 00:50
Match the following reasons with the statements given to create the proof. 1. do = ob, ao = oc sas 2. doc = aob given 3. triangle cod congruent to triangle aob vertical angles are equal. 4. 1 = 2, ab = dc if two sides = and ||, then a parallelogram. 5. ab||dc if alternate interior angles =, then lines parallel. 6. abcd is a parallelogram cpcte
Answers: 3
You know the right answer?
Questions


Mathematics, 22.01.2022 21:00

Mathematics, 22.01.2022 21:00
Mathematics, 22.01.2022 21:00

Mathematics, 22.01.2022 21:10

Geography, 22.01.2022 21:10

Biology, 22.01.2022 21:10
Mathematics, 22.01.2022 21:10
Mathematics, 22.01.2022 21:10


