The graphs below have the same shape. Complete the equation of the blue
graph. Enter exponents...

Mathematics, 27.05.2020 06:59 tiasoraw
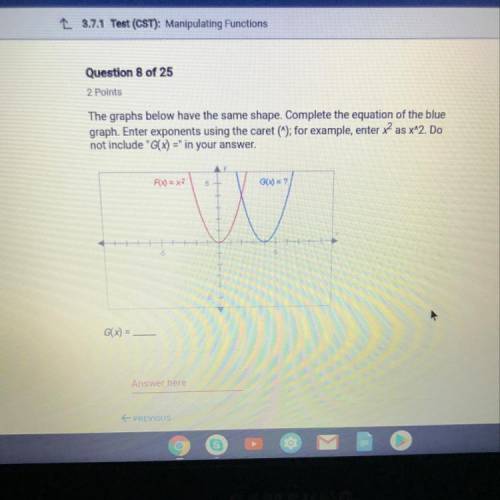
The graphs below have the same shape. Complete the equation of the blue
graph. Enter exponents using the caret (^); for example, enter x2 as x^2. Do
not include "G(x) =" in your answer. f(x)=x^2

Answers: 2
Another question on Mathematics
Mathematics, 21.06.2019 20:20
Select the correct answer from each drop-down menu. the length of a rectangle is 5 inches more than its width. the area of the rectangle is 50 square inches. the quadratic equation that represents this situation is the length of the rectangle is inches.
Answers: 1
Mathematics, 22.06.2019 02:10
Overproduction of uric acid in the body can be an indication of cell breakdown. this may be an advance indication of illness such as gout, leukemia, or lymphoma.† over a period of months, an adult male patient has taken nine blood tests for uric acid. the mean concentration was x = 5.35 mg/dl. the distribution of uric acid in healthy adult males can be assumed to be normal, with σ = 1.87 mg/dl. (a) find a 95% confidence interval for the population mean concentration of uric acid in this patient's blood. what is the margin of error? (round your answers to two decimal places.) lower limit upper limit margin of error (b) what conditions are necessary for your calculations? (select all that apply.) σ is unknown n is large σ is known normal distribution of uric acid uniform distribution of uric acid (c) interpret your results in the context of this problem. there is not enough information to make an interpretation. the probability that this interval contains the true average uric acid level for this patient is 0.05. the probability that this interval contains the true average uric acid level for this patient is 0.95. there is a 95% chance that the confidence interval is one of the intervals containing the population average uric acid level for this patient. there is a 5% chance that the confidence interval is one of the intervals containing the population average uric acid level for this patient. (d) find the sample size necessary for a 95% confidence level with maximal margin of error e = 1.10 for the mean concentration of uric acid in this patient's blood. (round your answer up to the nearest whole number.) blood tests
Answers: 2
Mathematics, 22.06.2019 04:30
Mrs. piazza invested 8000 in a certificate of deposit that pays 3% simple interest for 4 years. how much will be in mrs. piazza's account at the end of 4 years
Answers: 1
You know the right answer?
Questions

Health, 14.10.2019 20:00


Advanced Placement (AP), 14.10.2019 20:00
Mathematics, 14.10.2019 20:00

Mathematics, 14.10.2019 20:00
Mathematics, 14.10.2019 20:00

History, 14.10.2019 20:00

Mathematics, 14.10.2019 20:00
Mathematics, 14.10.2019 20:00

History, 14.10.2019 20:00


