
Mathematics, 23.05.2020 21:05 JesuGranger
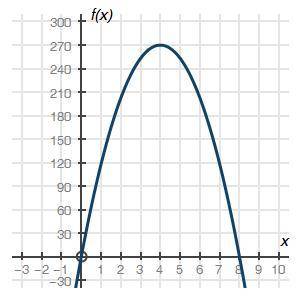
The graph below shows a company's profit f(x), in dollars, depending on the price of erasers x, in dollars, sold by the company:
Part A: What do the x-intercepts and maximum value of the graph represent? What are the intervals where the function is increasing and decreasing, and what do they represent about the sale and profit? (4 points)
Part B: What is an approximate average rate of change of the graph from x = 1 to x = 4, and what does this rate represent? (3 points)
Part C: Describe the constraints of the domain. (3 points)

Answers: 3
Another question on Mathematics
Mathematics, 21.06.2019 13:20
The probability of winning something on a single play at a slot machine is 0.11. after 4 plays on the slot machine, what is the probability of winning at least once
Answers: 1
Mathematics, 21.06.2019 15:00
Use the graph to determine the range. which notations accurately represent the range? check all that apply. (–∞, 2) u (2, ∞) (–∞, –2) u (–2, ∞) {y|y ∈ r, y ≠ –2} {y|y ∈ r, y ≠ 2} y < 2 or y > 2 y < –2 or y > –2
Answers: 1
Mathematics, 21.06.2019 20:00
Marcus and cody both leave the park at the same time, but in opposite directions. if cody travels 6 mph faster than marcus and after 4 hours they are 64 miles apart, how fast is each traveling? solve using rare times time = distance.
Answers: 1
You know the right answer?
The graph below shows a company's profit f(x), in dollars, depending on the price of erasers x, in d...
Questions

English, 17.02.2021 02:00
Mathematics, 17.02.2021 02:00
Mathematics, 17.02.2021 02:00
Mathematics, 17.02.2021 02:00
Mathematics, 17.02.2021 02:00

Geography, 17.02.2021 02:00

Social Studies, 17.02.2021 02:00
Mathematics, 17.02.2021 02:00

History, 17.02.2021 02:00
Mathematics, 17.02.2021 02:00
Mathematics, 17.02.2021 02:00
Mathematics, 17.02.2021 02:00
Mathematics, 17.02.2021 02:00
Mathematics, 17.02.2021 02:00

Computers and Technology, 17.02.2021 02:00


