
A mathematics teacher wanted to see the correlation between test scores and
homework. The home...

Mathematics, 23.05.2020 00:06 GiuliAzevedo
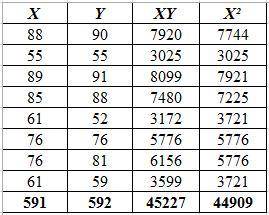
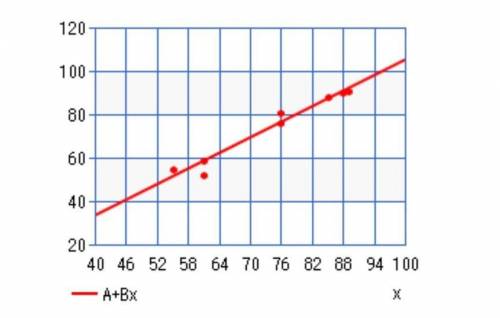
A mathematics teacher wanted to see the correlation between test scores and
homework. The homework grade (x) and test grade (y) are given in the accompanying
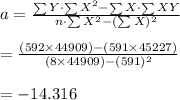
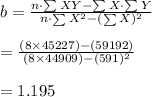
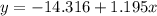
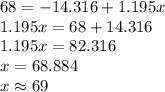
table. Write the linear regression equation that represents this set of data, rounding
all coefficients to the nearest hundredth. Using this equation, estimate the homework
grade, to the nearest integer, for a student with a test grade of 68.
Homework Grade (x) Test Grade (y)
X | Y
88 | 90
55 | 55
89 | 91
85 | 88
61 | 52
76 | 76
76 | 81
61 | 59

Answers: 1
Another question on Mathematics
Mathematics, 22.06.2019 01:00
The random variable x is defined as the number marking the sector in which the arrow lands when the spinner in the diagram is spun once.
Answers: 2
Mathematics, 22.06.2019 02:00
Angie has saved 3/8 of the amount she needs to buy a bike. clive has saved 7/10 of the amount he needs to buy a skateboard. what is the difference between clive's and angie's fraction of savings?
Answers: 1
You know the right answer?
Questions


Advanced Placement (AP), 25.07.2019 14:00
Mathematics, 25.07.2019 14:00

Social Studies, 25.07.2019 14:00

Biology, 25.07.2019 14:00

History, 25.07.2019 14:00

Physics, 25.07.2019 14:00


