
Mathematics, 22.05.2020 13:58 nikki225
HELP PLEASE! I know someone else has answered this before but I'm so confused about how they came up with it PLEASE HELP!
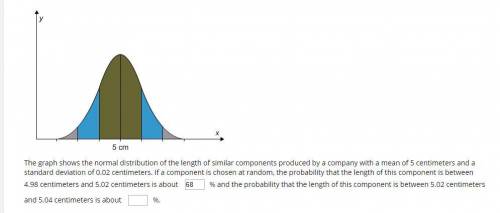
The graph shows the normal distribution of the length of similar components produced by a company with a mean of 5 centimeters and a standard deviation of 0.02 centimeters. If a component is chosen at random, the probability that the length of this component is between 4.98 centimeters and 5.02 centimeters is about

Answers: 3
Another question on Mathematics
Mathematics, 21.06.2019 13:30
Suppose the first five terms of a sequence are 4, 5, 9, 27, 123. how could the next term in the sequence be generated?
Answers: 1
Mathematics, 21.06.2019 16:30
Problem fathi wants to print out a pdf document that is 48 pages long. to save paper, he decides to print on both sides of each sheet and to print two pages on each side of the sheet. how many sheets of paper will he need?
Answers: 3
Mathematics, 21.06.2019 18:00
Two students were asked if they liked to read. is this a good example of a statistical question? why or why not? a yes, this is a good statistical question because a variety of answers are given. b yes, this is a good statistical question because there are not a variety of answers that could be given. c no, this is not a good statistical question because there are not a variety of answers that could be given. no, this is not a good statistical question because there are a variety of answers that could be given
Answers: 1
You know the right answer?
HELP PLEASE! I know someone else has answered this before but I'm so confused about how they came up...
Questions

History, 03.07.2019 05:50

Spanish, 03.07.2019 05:50
Mathematics, 03.07.2019 05:50


Chemistry, 03.07.2019 05:50
Mathematics, 03.07.2019 05:50

Biology, 03.07.2019 05:50
History, 03.07.2019 05:50
Mathematics, 03.07.2019 05:50


