Y = a + bx
The graph and accompanying table shown here display 12
observations of a pair o...

Mathematics, 22.05.2020 03:12 nana54muller
Y = a + bx
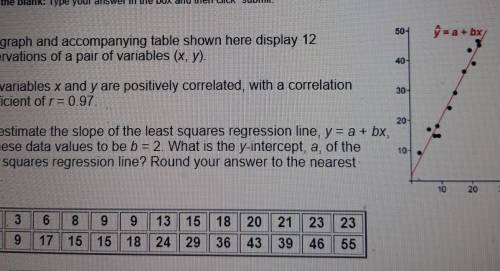
The graph and accompanying table shown here display 12
observations of a pair of variables (x, y).
The variables x and y are positively correlated, with a correlation
coefficient of r=0.97.
You estimate the slope of the least squares regression line, y= a + bx,
for these data values to be b = 2. What is the y-intercept, a, of the
least squares regression line? Round your answer to the nearest
tenth.
x3 6 8 9 9 13 | 15 | 18 20 | 21 | 23 | 23
y9 17 15 15 24 29 36 43 | 39 | 46 55

Answers: 3
Another question on Mathematics
Mathematics, 21.06.2019 12:30
What basic trigonometric identity would you use to verify that sin x cos x tan x =1-cos^(2)x?
Answers: 2
Mathematics, 21.06.2019 21:30
Using the information in the customer order, determine the length and width of the garden. enter the dimensions. length: feet width: feet
Answers: 3
Mathematics, 22.06.2019 00:00
Arectangle plot measure 20ft. by 30ft. a 3-ft.-wide sidewalk surrounds it.find the area of the sidewalk.
Answers: 1
Mathematics, 22.06.2019 00:30
Me i’m stuck on all these questions besides the two bottom ones
Answers: 2
You know the right answer?
Questions
Mathematics, 23.06.2019 21:30

Physics, 23.06.2019 21:30
Mathematics, 23.06.2019 21:30

History, 23.06.2019 21:30


Mathematics, 23.06.2019 21:30
Mathematics, 23.06.2019 21:30


