
Mathematics, 10.05.2020 08:57 freddhendrickss
The accompanying data represent the weights of various domestic cars and their gas mileages in the city. The linear correlation coefficient between the weight of a car and its miles per gallon in the city is requalsnegative 0.992. The least-squares regression line treating weight as the explanatory variable and miles per gallon as the response variable is Modifying Above y with caret equals negative 0.0073 x plus 45.2243. Complete parts (a) through (c) below. Click the icon to view the data table.
1. What proportion of the variability in miles per gallon is explained by the relation between weight of the car and miles per gallon?
2. The proportion of the variability in miles per gallon explained by the relation between weight of the car and miles per gallon is %. (Round to one decimal place as needed.)
3. Interpret the coefficient of determination. % of the variance in is by the linear model.

Answers: 2
Another question on Mathematics
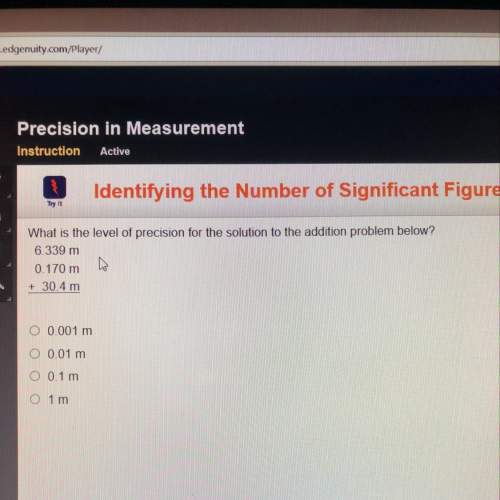
Mathematics, 21.06.2019 17:00
Which of the following equations is of the parabola whose vertex is at (4, 3), axis of symmetry parallel to the y-axis and focus at (4, -3)? a.) y+3=1/24 (x+4)^2 b.)y-3=-1/24 (x-4)^2 c.)x-4=-1/24 (y-3)^2
Answers: 3
Mathematics, 21.06.2019 17:00
The table shows population statistics for the ages of best actor and best supporting actor winners at an awards ceremony. the distributions of the ages are approximately bell-shaped. compare the z-scores for the actors in the following situation. best actor best supporting actor muequals42.0 muequals49.0 sigmaequals7.3 sigmaequals15 in a particular year, the best actor was 59 years old and the best supporting actor was 45 years old. determine the z-scores for each. best actor: z equals best supporting actor: z equals (round to two decimal places as needed.) interpret the z-scores. the best actor was (more than 2 standard deviations above more than 1 standard deviation above less than 1 standard deviation above less than 2 standard deviations below) the mean, which (is not, is) unusual. the best supporting actor was (less than 1 standard deviation below more than 1 standard deviation above more than 2 standard deviations below more than 1 standard deviation below) the mean, which (is is not) unusual.
Answers: 1
Mathematics, 21.06.2019 17:10
The number of chocolate chips in an 18-ounce bag of chocolate chip cookies is approximately normally distributed with a mean of 1252 chips and standard deviation 129 chips. (a) what is the probability that a randomly selected bag contains between 1100 and 1500 chocolate chips, inclusive? (b) what is the probability that a randomly selected bag contains fewer than 1125 chocolate chips? (c) what proportion of bags contains more than 1225 chocolate chips? (d) what is the percentile rank of a bag that contains 1425 chocolate chips?
Answers: 1
Mathematics, 21.06.2019 23:30
Find the directions in which the function increases and decreases most rapidly at upper p 0p0. then find the derivatives of the function in these directions. f(x,y)equals=x squared plus xy plus y squaredx2+xy+y2, upper p 0p0left parenthesis 1 comma negative 4 right parenthesis
Answers: 2
You know the right answer?
The accompanying data represent the weights of various domestic cars and their gas mileages in the c...
Questions


Physics, 07.10.2020 23:01


History, 07.10.2020 23:01

Geography, 07.10.2020 23:01
Mathematics, 07.10.2020 23:01
Mathematics, 07.10.2020 23:01
Social Studies, 07.10.2020 23:01
Mathematics, 07.10.2020 23:01
Biology, 07.10.2020 23:01
Mathematics, 07.10.2020 23:01


