
Mathematics, 08.05.2020 15:57 marygomez11
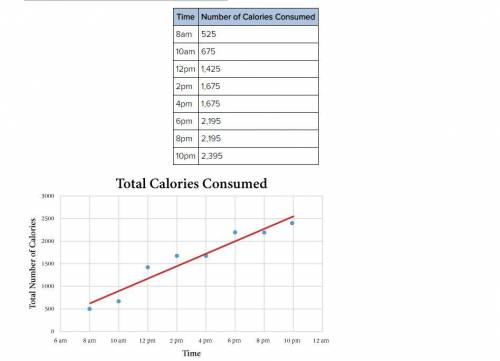
The data in the table and on the scatter plot shows the relationship between the time of day and the total number of calories that a teenager consumes throughout the day.
Write the equation of the best fit line in slope-intercept form. Include all of your calculations in your final answer.
Hint: On the plot, the time is represented using a 12-hour clock. To get an accurate equation, you will want to represent the time using a 24-hour clock instead. For example, 2 pm can be represented as 12 + 2 = 14.

Answers: 2
Another question on Mathematics
Mathematics, 21.06.2019 15:00
Which of these choices show a pair of equivalent expressions?
Answers: 1
Mathematics, 21.06.2019 19:30
What is the image of c for a 90° counterclockwise rotation about a? (3, 7) (-1, 3) (7, 3)
Answers: 1
Mathematics, 21.06.2019 22:00
1) prove that 731^3−631^3 is divisible by 100 2) prove that 99^3−74^3 is divisible by 25
Answers: 2
Mathematics, 21.06.2019 23:30
Determine if the following statement is true or false. the normal curve is symmetric about its​ mean, mu. choose the best answer below. a. the statement is false. the normal curve is not symmetric about its​ mean, because the mean is the balancing point of the graph of the distribution. the median is the point where​ 50% of the area under the distribution is to the left and​ 50% to the right.​ therefore, the normal curve could only be symmetric about its​ median, not about its mean. b. the statement is true. the normal curve is a symmetric distribution with one​ peak, which means the​ mean, median, and mode are all equal.​ therefore, the normal curve is symmetric about the​ mean, mu. c. the statement is false. the mean is the balancing point for the graph of a​ distribution, and​ therefore, it is impossible for any distribution to be symmetric about the mean. d. the statement is true. the mean is the balancing point for the graph of a​ distribution, and​ therefore, all distributions are symmetric about the mean.
Answers: 2
You know the right answer?
The data in the table and on the scatter plot shows the relationship between the time of day and the...
Questions


Mathematics, 01.07.2019 08:30

Biology, 01.07.2019 08:30

Mathematics, 01.07.2019 08:30
Mathematics, 01.07.2019 08:30
Mathematics, 01.07.2019 08:30
Mathematics, 01.07.2019 08:30


