David has been tasked with tracking the number of bagels sold () at Freddy's
24-Hour Bagel Shop...

Mathematics, 08.05.2020 04:57 amberpetty4288
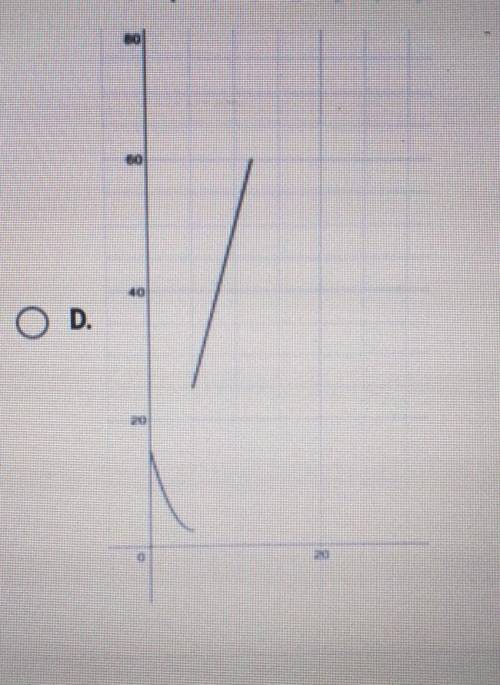
David has been tasked with tracking the number of bagels sold () at Freddy's
24-Hour Bagel Shop from 12:00 AM (x = 0) to 12:00 PM (x = 12). David
notices that from 12:00 AM to 4:59 AM 5 more bagels are sold each hour
than were sold during the previous hour and from 5:00 AM to 12:00 PM the
number of bagels sold is a function of half the square of the time (x) minus 5
times the time (x) plus 15. Which of the following graphs is representative of
David's findings?

Answers: 2
Another question on Mathematics
Mathematics, 20.06.2019 18:04
P= $1400,300 r = 7 1/2% t = 4 what is i ? $4.29 $429.00 $4290.00
Answers: 1
Mathematics, 21.06.2019 17:30
Which of the following is correct interpretation of the expression -4+13
Answers: 2
Mathematics, 21.06.2019 17:30
Miguel’s teacher asks him to color 4/8 of his grid. he must use 3 colors: red, blue, and green. there must be more green sections than red sections. how can miguel color all the sections of his grid to follow all the rules
Answers: 1
You know the right answer?
Questions


Mathematics, 28.07.2020 16:01


Social Studies, 28.07.2020 16:01


English, 28.07.2020 17:01
Mathematics, 28.07.2020 17:01
Mathematics, 28.07.2020 17:01


