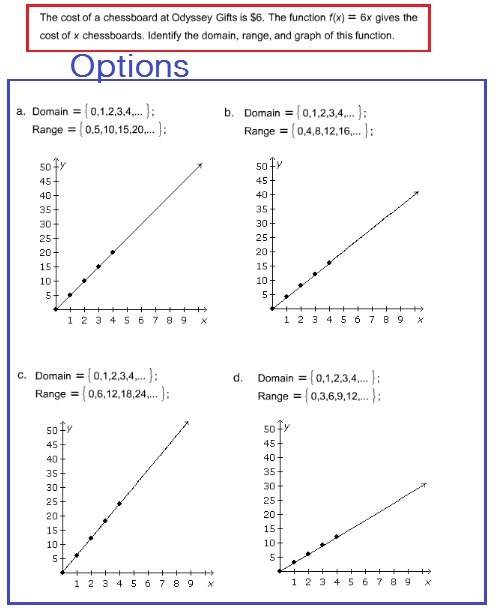
.
hi
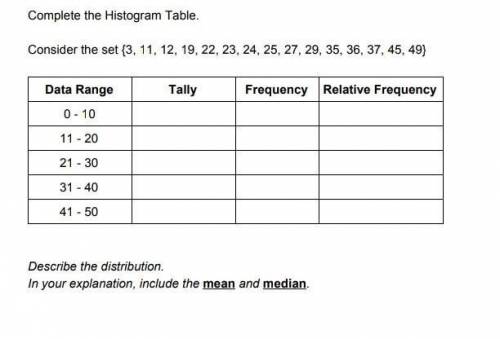
Complete the Histogram Table.
HHH
DU
Consider the set {3, 11, 12, 19,...

Mathematics, 07.05.2020 04:09 aidenbender06
.
hi
Complete the Histogram Table.
HHH
DU
Consider the set {3, 11, 12, 19, 22, 23, 24, 25, 27, 29, 35, 36, 37, 45, 49}
e
SEST
Data Range
FM
Tally
Frequency
Relative
Frequency
TGT
0 - 10
11 - 20
21 - 30
31 - 40
LLL
w
1
1
1
.
INCIN
41 - 50
TA
Describe the distribution.
In your explanation, include the mean and median.
nean
edia

Answers: 3
Another question on Mathematics
Mathematics, 21.06.2019 17:00
The equation of a circle is (x + 4)2 + (y + 6)2 = 16. determine the length of the radius. 10 4 16 8 my flower basket delivers flowers within a 20 mile radius of their store. if this area is represented graphically, with my flower basket located at (5, 2), what is the equation that represents the delivery area? (x - 2)2 + (y - 5)2 = 20 (x - 5)2 + (y - 2)2 = 20 (x + 5)2 + (y + 2)2 = 400 (x - 5)2 + (y - 2)2 = 400
Answers: 1
Mathematics, 21.06.2019 18:00
Last year, a state university received 3,560 applications from boys. of those applications, 35 percent were from boys who lived in other states. part a)how many applications did the university receive from boys who lived in other states? part b)applications to the university from boys represented 40percent of all applications. how many applications did the university receive in all? i don't how to do part b so me and plz tell how you got your answer
Answers: 1
You know the right answer?
Questions
Mathematics, 07.10.2019 07:30

Social Studies, 07.10.2019 07:30
Mathematics, 07.10.2019 07:30

Chemistry, 07.10.2019 07:30


Biology, 07.10.2019 07:30
Mathematics, 07.10.2019 07:30

Mathematics, 07.10.2019 07:30

History, 07.10.2019 07:30
Mathematics, 07.10.2019 07:30
Biology, 07.10.2019 07:50
Mathematics, 07.10.2019 07:50


