Activity
Genivieve and Mindy kept a record of how many ounces of water they drank each day. Th...

Mathematics, 06.05.2020 00:35 camiloriveraveoxbgd6
Activity
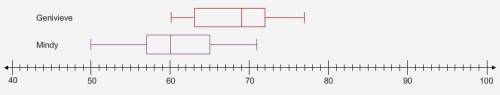
Genivieve and Mindy kept a record of how many ounces of water they drank each day. The two box plots represent the data they gathered.
In this activity, you'll use the data in the box plots to determine the medians and interquartile ranges. Then you’ll compare the values to assess the degree of overlap for the two data distributions.
Part A
What is the median amount of water (in ounces) that Genivieve drank per day?

Answers: 3
Another question on Mathematics
Mathematics, 21.06.2019 14:10
Olivia uses the work below to determine 55% of 720 which explains the error in olivia’s solution
Answers: 1
Mathematics, 21.06.2019 22:30
Convert (-3,0) to polar form. a. (3,0’) b. (-3,180’) c. (3,180’) d. (3,360’)
Answers: 1
Mathematics, 22.06.2019 00:20
Astudent showed the steps below while solving the inequality |x-4|< 1 by graphing.
Answers: 3
Mathematics, 22.06.2019 00:30
Sawsan recorded the favorite sport of students at her school. she surveyed 200 students. how many students chose tennis?
Answers: 2
You know the right answer?
Questions


Physics, 20.09.2020 07:01

Arts, 20.09.2020 07:01


Law, 20.09.2020 07:01

Social Studies, 20.09.2020 07:01

World Languages, 20.09.2020 07:01
Mathematics, 20.09.2020 07:01

French, 20.09.2020 07:01

Business, 20.09.2020 07:01
Mathematics, 20.09.2020 07:01
Mathematics, 20.09.2020 07:01


