Describe how the graph below is deceptive.
How would you change it so that it is not mi...

Mathematics, 05.05.2020 00:18 austintules2005
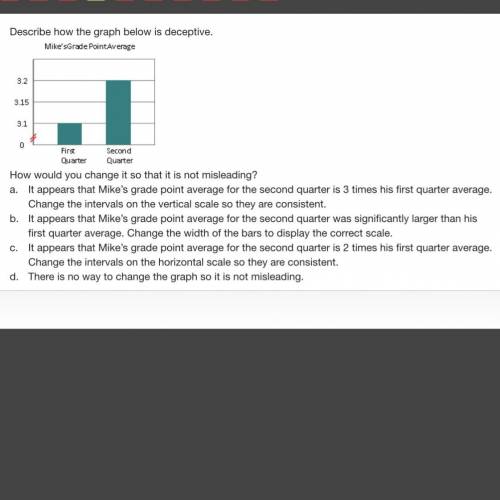
Describe how the graph below is deceptive.
How would you change it so that it is not misleading?
a.
It appears that Mike’s grade point average for the second quarter is 3 times his first quarter average. Change the intervals on the vertical scale so they are consistent.
b.
It appears that Mike’s grade point average for the second quarter was significantly larger than his first quarter average. Change the width of the bars to display the correct scale.
c.
It appears that Mike’s grade point average for the second quarter is 2 times his first quarter average. Change the intervals on the horizontal scale so they are consistent.
d.
There is no way to change the graph so it is not misleading.

Answers: 2
Another question on Mathematics
Mathematics, 21.06.2019 17:00
Aquantity with an initial value of 3900 decays exponentially at a rate of 35% every hour. what is the value of the quantity after 0.5 days, to the nearest hundredth?
Answers: 1
Mathematics, 21.06.2019 17:30
If the class was going to get a class pet and 5 picked fish and 7 pick bird and 8 picked rabbits have many students were in the
Answers: 1
Mathematics, 21.06.2019 20:30
The graph of y x3 is translated so that the point (1. 1) is moved to (1, 4). what is the equation of the new graph?
Answers: 1
You know the right answer?
Questions


Mathematics, 27.03.2020 00:41

Mathematics, 27.03.2020 00:42
History, 27.03.2020 00:42
History, 27.03.2020 00:42
Mathematics, 27.03.2020 00:42
Mathematics, 27.03.2020 00:42


