Please help its due today :)))
The graph below plots the values of y for different value...

Mathematics, 05.05.2020 11:24 victoria6929
Please help its due today :)))
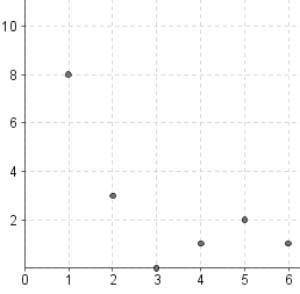
The graph below plots the values of y for different values of x:
What does a correlation coefficient of −0.2 say about this graph?
x and y have a strong, positive correlation
x and y have a weak, positive correlation
x and y have a strong, negative correlation
x and y have a weak, negative correlation

Answers: 2
Another question on Mathematics
Mathematics, 21.06.2019 15:00
What is the slope simplify your answer and write it as a proper fraction, improper fraction, or integer
Answers: 2
Mathematics, 21.06.2019 18:30
You were told that the amount of time lapsed between consecutive trades on the new york stock exchange followed a normal distribution with a mean of 15 seconds. you were also told that the probability that the time lapsed between two consecutive trades to fall between 16 to 17 seconds was 13%. the probability that the time lapsed between two consecutive trades would fall below 13 seconds was 7%. what is the probability that the time lapsed between two consecutive trades will be between 14 and 15 seconds?
Answers: 3
Mathematics, 21.06.2019 23:30
Which pair of numbers is relatively prime? a. 105 and 128 b. 130 and 273 c. 205 and 350 d. 273 and 333
Answers: 3
You know the right answer?
Questions


Computers and Technology, 28.01.2020 02:31


