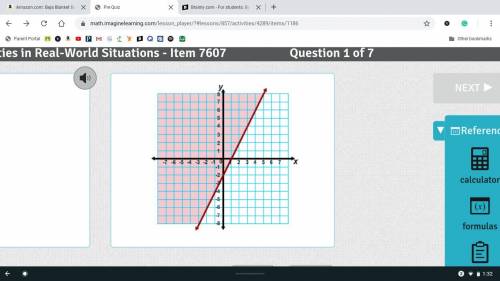
Which inequality describes the graph?
A. y ≥ -2 + 2x
B. y – 2 ≥ -2x
C. y ≤ 2...

Mathematics, 06.05.2020 05:17 Tabbicat021
Which inequality describes the graph?
A. y ≥ -2 + 2x
B. y – 2 ≥ -2x
C. y ≤ 2x – 2
D. y > 2x – 2

Answers: 1
Another question on Mathematics
Mathematics, 21.06.2019 19:00
Explain why the factor 1.5 is broke. into two numbers in the model.
Answers: 3
Mathematics, 21.06.2019 23:30
Hundred and tens tables to make 430 in five different ways
Answers: 1
Mathematics, 22.06.2019 04:30
The westins and the shermans live in the same city and pay the same sales tax rate, and both families made $14,000 in taxable purchases last year. if the westins made $86,000 and the shermans made $33,000 last year, is the sales tax in their city an example of a regressive tax? yes, because the westins and the shermans both paid the same sales tax rate. b. no, because the shermans paid a higher percentage of their income in sales tax than the westins did. c. no, because the westins and the shermans both paid the same sales tax rate. d. yes, because the shermans paid a higher percentage of their income in sales tax than the westins did.
Answers: 1
Mathematics, 22.06.2019 05:00
He factorization of 8x3 – 125 is (2x – 5)(jx2 + kx + 25). what are the values of j and k?
Answers: 1
You know the right answer?
Questions


Advanced Placement (AP), 14.06.2021 16:00


Mathematics, 14.06.2021 16:00


Social Studies, 14.06.2021 16:00
Mathematics, 14.06.2021 16:00
Social Studies, 14.06.2021 16:00


