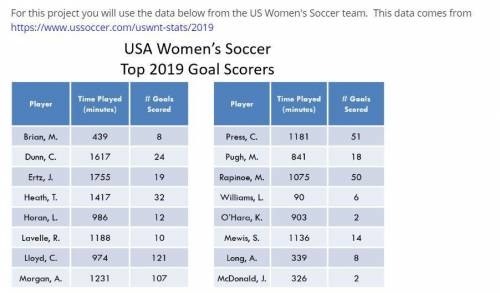
1 fill in the frequency table for time played in minutes.
2 Use desmos to make a histogram for...

Mathematics, 06.05.2020 06:08 lindseycagle00
1 fill in the frequency table for time played in minutes.
2 Use desmos to make a histogram for the frequency table in #2. Take a screenshot of your histogram and save it on your computer. and put it on here
3 Describe your histogram in #3 in 1-2 sentences. What type of data distribution is this (bell, uniform, skewed right, or skewed left)? How do you know what type of distribution your graph shows?
4 fill in the frequency table for # of goals scored.
5 make a histogram for the frequency table in #5. Take a screenshot of your histogram and save it on your computer. and share it here please
Describe your histogram in #6 in 1-2 sentences. What type of data distribution is this (bell, uniform, skewed right, or skewed left)? How do you know what type of distribution your graph shows?
thank you :)

Answers: 1
Another question on Mathematics
Mathematics, 21.06.2019 16:10
On new year's day, the average temperature of a city is 5.7 degrees celsius. but for new year's day 2012, the temperature was 9.8 degrees below the average. i) if a represents the average temperature on new year's day and 7 represents the temperature on new year's day 2012, what formula accurately relates the two values together? ii) what was the temperature on new year's day 2012? dt a 0.8 ii) - 4 1 degrees celsius da-t-98 ii) 59 degrees celsius 1) 7 = -9,8 11) 59 degrees celsius ii) l degrees celsius
Answers: 2
Mathematics, 21.06.2019 22:00
Sara has been reading about different types of financial grants, including federal pell grants, academic competitiveness grants, smart grants, and teach grants. which statement about these grants is true? filling out a fafsa will not her apply for these grants. she will not have to pay back any funds she receives from these grants. these grants only go to students with less than a 3.0 gpa. she will have to pay back all the funds she receives from these grants.
Answers: 2
Mathematics, 21.06.2019 23:20
This graph shows which inequality? a ≤ –3 a > –3 a ≥ –3 a < –3
Answers: 1
Mathematics, 22.06.2019 01:30
Use the given degree of confidence and sample data to construct a confidence interval for the population mean mu . assume that the population has a normal distribution. a laboratory tested twelve chicken eggs and found that the mean amount of cholesterol was 185 milligrams with sequals 17.6 milligrams. a confidence interval of 173.8 mgless than muless than 196.2 mg is constructed for the true mean cholesterol content of all such eggs. it was assumed that the population has a normal distribution. what confidence level does this interval represent?
Answers: 1
You know the right answer?
Questions


Mathematics, 15.12.2020 01:00

History, 15.12.2020 01:00

Spanish, 15.12.2020 01:00

Law, 15.12.2020 01:00

Mathematics, 15.12.2020 01:00
English, 15.12.2020 01:00

Biology, 15.12.2020 01:00

Social Studies, 15.12.2020 01:00


