
Mathematics, 25.04.2020 00:45 SmokeyRN
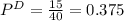
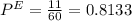
Researchers are studying two populations of sea turtles. In population D, 30 percent of the turtles have a shell length greater than 2 feet. In population E, 20 percent of the turtles have a shell length greater than 2 feet. From a random sample of 40 turtles selected from D, 15 had a shell length greater than 2 feet. From a random sample of 60 turtles selected from E, 11 had a shell length greater than 2 feet. Let pˆD represent the sample proportion for D, and let pˆE represent the sample proportion for E.
Question 2
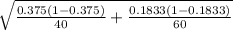
(b) What are the mean and standard deviation of the sampling distribution of the difference in sample proportions pˆD−pˆE ? Show your work and label each value.
(c) Can it be assumed that the sampling distribution of the difference of the sample proportions pˆD−pˆE is approximately normal? Justify your answer.
(d) Consider your answer in part (a). What is the probability that pˆD−pˆE is greater than the value found in part (a)? Show your work

Answers: 1
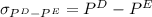 = 0.375 -0.1833 = 0.1917
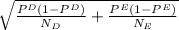
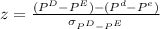
 = 1.0029
Another question on Mathematics
Mathematics, 21.06.2019 15:00
Hye ryung is the president of the local chapter of the american medical students association (amsa). she is organizing local outreach and informational meetings. at her first meeting there are five people present (including herself). every month after that her group grows by 5 people. a. how many members are in the group after 6 months? b. the logistics of hosting and feeding her group at meetings was more complicated than expected. the cost of feeding 5 people at her first meeting was $30, for 10 people it was $35, for 15 it was $45, and after 6 months all of the costs had added up to $100. write a function to model the cost with the number of people attending meetings. c. what connections can you make between the linear growth of the group’s membership and the increasing costs of running meetings?
Answers: 3
Mathematics, 21.06.2019 23:00
The weight of a radioactive isotope was 96 grams at the start of an experiment. after one hour, the weight of the isotope was half of its initial weight. after two hours, the weight of the isotope was half of its weight the previous hour. if this pattern continues, which of the following graphs represents the weight of the radioactive isotope over time? a. graph w b. graph x c. graph y d. graph z
Answers: 2
Mathematics, 22.06.2019 00:00
The graph shows the decibel measure for sounds depending on how many times as intense they are as the threshold of sound. noise in a quiet room is 500 times as intense as the threshold of sound. what is the decibel measurement for the quiet room? 20 decibels28 decibels200 decibels280 decibels
Answers: 1
Mathematics, 22.06.2019 01:30
Becca wants to mix fruit juice and soda to make a punch. she can buy fruit juice for $3 a gallon and soda for $4 a gallon. if she wants to make 28 gallons of punch at a cost of $3.25 a gallon, how many gallons of fruit juice and how many gallons of soda should she buy?
Answers: 2
You know the right answer?
Researchers are studying two populations of sea turtles. In population D, 30 percent of the turtles...
Questions


Computers and Technology, 22.04.2020 15:56
Mathematics, 22.04.2020 15:56
Physics, 22.04.2020 15:56
Mathematics, 22.04.2020 15:56

Social Studies, 22.04.2020 15:56


