Price
200
Month
Which graph appears to show the best performance? Which scale make...

Mathematics, 24.04.2020 08:00 alexandrecarmene
Price
200
Month
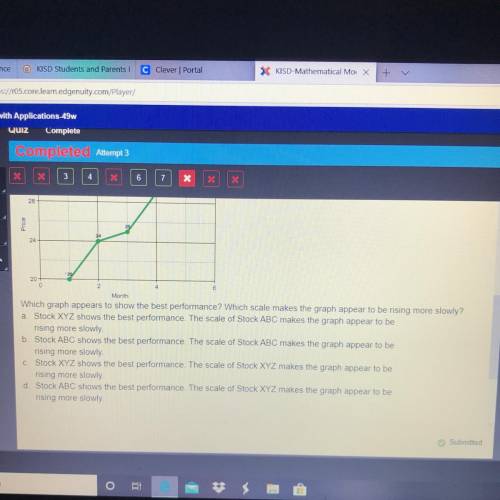
Which graph appears to show the best performance? Which scale makes the graph appear to be rising more slowly?
a. Stock XYZ shows the best performance. The scale of Stock ABC makes the graph appear to be
rising more slowly
b. Stock ABC shows the best performance. The scale of Stock ABC makes the graph appear to be
rising more slowly
C. Stock XYZ shows the best performance. The scale of Stock XYZ makes the graph appear to be
rising more slowly
d Stock ABC shows the best performance. The scale of Stock XYZ makes the graph appear to be
rising more slowly

Answers: 2
Another question on Mathematics
Mathematics, 21.06.2019 20:00
Given the graphed function below which of the following orders pairs are found on the inverse function
Answers: 1
Mathematics, 21.06.2019 20:10
A. use the formula for continuous compounding with the original example: $1000 invested at 2% for 1 year. record the amount to 5 decimal places. use a calculator. b. compare it to the result using the original compound interest formula with n = 365 calculated to 5 decimal places. which has a larger value? explain.
Answers: 1
Mathematics, 22.06.2019 00:30
If you were constructing a triangular frame, and you had wood in the length of 4inches, 4 inches, and 7 inches, would it make a triangle? would you be able to create a frame from these pieces of wood? yes or no. explain your mathematical thinking
Answers: 2
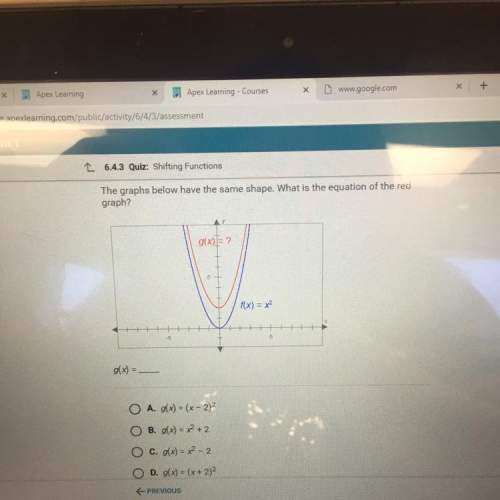
You know the right answer?
Questions


Mathematics, 10.07.2019 00:30
Mathematics, 10.07.2019 00:30
Mathematics, 10.07.2019 00:30

Computers and Technology, 10.07.2019 00:30


Spanish, 10.07.2019 00:30
Mathematics, 10.07.2019 00:30
Mathematics, 10.07.2019 00:30
Health, 10.07.2019 00:30


