
Mathematics, 24.04.2020 03:07 preciousweeks11
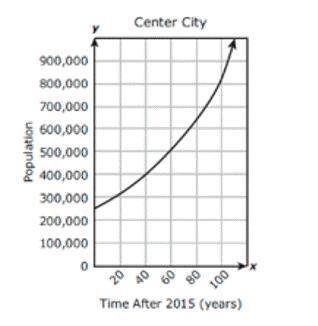
The population of Center City is modeled by exponential function f, where x is the number of years after the year 2015. The graph of f is shown on the grid.
Which inequality best represents the range of f in this situation?
250,000 ≤ y ≤ 1,000,000
x ≥ 0
y ≥ 250,000
0 ≤ x ≤ 110

Answers: 3
Another question on Mathematics
Mathematics, 21.06.2019 13:00
What is the ratio for the surface areas of rectangle prisims shown below given that they are similar and that the ratio of their edge lengths is 7: 3
Answers: 1
Mathematics, 21.06.2019 15:30
What is the volume of a rectangular prism that is 120 centimeters by 2 meters by 1.5 meters in cubic meters?
Answers: 1
Mathematics, 21.06.2019 20:50
The cost of turkey is directly proportional to its weight. if a 12-pount turkey costs $27, how much does a 16-pound turkey cost? a. $33.75 b. $36.00 c. $31.00 d. $32.50
Answers: 3
Mathematics, 21.06.2019 23:00
Siri can type 90 words in 40 minutes about how many words would you expect her to type in 10 minutes at this rate
Answers: 1
You know the right answer?
The population of Center City is modeled by exponential function f, where x is the number of years a...
Questions

History, 09.06.2021 14:00

Business, 09.06.2021 14:00


English, 09.06.2021 14:00

Social Studies, 09.06.2021 14:00
Mathematics, 09.06.2021 14:00
Business, 09.06.2021 14:00
Chemistry, 09.06.2021 14:00
Social Studies, 09.06.2021 14:00

Physics, 09.06.2021 14:00
Mathematics, 09.06.2021 14:00

Advanced Placement (AP), 09.06.2021 14:00
Chemistry, 09.06.2021 14:00
Social Studies, 09.06.2021 14:00
Chemistry, 09.06.2021 14:00
Social Studies, 09.06.2021 14:00


