
Mathematics, 21.04.2020 23:59 ginareyes0423
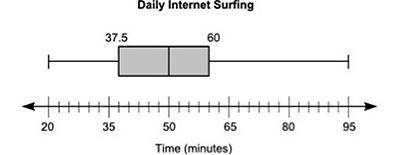
The box plot below shows the total amount of time, in minutes, the students of a class surf the Internet every day:
A box plot is shown. The left-most point on the plot is 20 and the right-most point is 95. The box is labeled 37.5 on the left edge and 60 on the right edge. A vertical line is drawn inside the rectangle at the point 50.
Part A: List two pieces of information that are provided by the graph and one piece of information that is not provided by the graph. (4 points)
Part B: Calculate the interquartile range of the data, and explain in a sentence or two what it represents. (4 points)
Part C: Explain what affect, if any, there will be if an outlier is present. (2 points)

Answers: 1
Another question on Mathematics
Mathematics, 21.06.2019 22:00
The two box p digram the two box plots show the data of the pitches thrown by two pitchers throughout the season. which statement is correct? check all that apply. pitcher 1 has a symmetric data set. pitcher 1 does not have a symmetric data set. pitcher 2 has a symmetric data set. pitcher 2 does not have a symmetric data set. pitcher 2 has the greater variation.ots represent the total number of touchdowns two quarterbacks threw in 10 seasons of play
Answers: 1
Mathematics, 21.06.2019 22:20
Select the correct answer from each drop-down menu. the table shows the annual sales revenue for different types of automobiles from three automobile manufacturers. sales revenue (millions of dollars) suv sedan truck marginal total b & b motors 22 15 9 46 pluto cars 25 27 10 62 panther motors 26 34 12 72 marginal total 73 76 31 180 the company with the highest percentage of sales revenue from sedans is . of the annual sales revenue from suvs, the relative frequency of pluto cars is .
Answers: 1
Mathematics, 22.06.2019 00:20
The police chief wants to know if the city’s african americans feel that the police are doing a good job. identify the management problem (i.e dependent variable) and identify the independent variable.
Answers: 1
You know the right answer?
The box plot below shows the total amount of time, in minutes, the students of a class surf the Inte...
Questions


Mathematics, 03.12.2020 21:40

Chemistry, 03.12.2020 21:40


Biology, 03.12.2020 21:40

Biology, 03.12.2020 21:40
Mathematics, 03.12.2020 21:40
History, 03.12.2020 21:40

Computers and Technology, 03.12.2020 21:40
English, 03.12.2020 21:40
English, 03.12.2020 21:40
Mathematics, 03.12.2020 21:40
Mathematics, 03.12.2020 21:40
Mathematics, 03.12.2020 21:40


