
Mathematics, 21.04.2020 19:37 bryneosburn
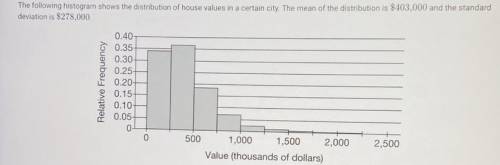
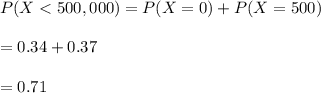
(a) Suppose one house from the city will be selected at random. Use the histogram to estimate the probability that the selected house is valued at less than $500,000. Show your work.
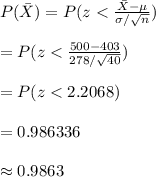
(b) Suppose a random sample of 40 houses are selected from the city. Estimate the probability that the mean value of the 40 houses is less than $500,000. Show your work.

Answers: 3
Another question on Mathematics
Mathematics, 21.06.2019 20:40
Describe the symmetry of the figure. identify lines of symmetry, if any. find the angle and the order of any rotational symmetry.
Answers: 1
Mathematics, 22.06.2019 01:30
In 2000, for a certain region, 27.1% of incoming college freshman characterized their political views as liberal, 23.1% as moderate, and 49.8% as conservative. for this year, a random sample of 400 incoming college freshman yielded the frequency distribution for political views shown below. a. determine the mode of the data. b. decide whether it would be appropriate to use either the mean or the median as a measure of center. explain your answer. political view frequency liberal 118 moderate 98 conservative 184 a. choose the correct answer below. select all that apply. a. the mode is moderate. b. the mode is liberal. c. the mode is conservative. d. there is no mode.
Answers: 1
Mathematics, 22.06.2019 01:30
Cherie works in retail and her weekly salary includes commission for the amount she sells. the equation s=400+0.15c models the relation between her weekly salary, s, in dollars and the amount of her sales, c, in dollars. interpret the slope of the equation.
Answers: 3
Mathematics, 22.06.2019 04:50
Q.1 dr. frank needs to choose 3 students from her advanced biology course to attend a conference in hawaii. the course has 40 students. which of the following methods could dr. frank use to choose a simple, random sample of 3 students? select all that apply. 1 dr. frank could have the students line up from shortest to tallest, then use her birthdate, 2/5/39, to select 3 students from the line (the 2nd student, the 5th student, and the 39th student). 2. dr. frank could upload her class roster into a spreadsheet and use a ranom-number generating function to produce 3 random numbers. the students whose names are located in the rows with these 3 numbers on the spreadsheet would be chosen. 3. dr. frank could choose the students with the 3 highest grades in the class. 4. dr. frank could count to three, then the first students to come to the front of the classroom and grab a golden ticket from her hand would be selected. 5. dr. frank could ask all students to write their name on a card, place all of the cards in a hat, shake the hat, and then pull 3 cards out from the hat. the students whose names appear on those 3 cards will be selected. 6. dr. frank could ask for volunteers to go to the conference, then choose the first 3 students who raise their hands. q2. now, choose one of the methods that you did not select and explain why this method would not result in a simple, random sample:
Answers: 2
You know the right answer?
(a) Suppose one house from the city will be selected at random. Use the histogram to estimate the pr...
Questions

Mathematics, 03.02.2021 01:50
English, 03.02.2021 01:50

Mathematics, 03.02.2021 01:50

Chemistry, 03.02.2021 01:50

English, 03.02.2021 01:50
Mathematics, 03.02.2021 01:50

Social Studies, 03.02.2021 01:50

SAT, 03.02.2021 01:50
History, 03.02.2021 01:50
Mathematics, 03.02.2021 01:50
Mathematics, 03.02.2021 01:50


