
Mathematics, 21.04.2020 16:40 bmr12
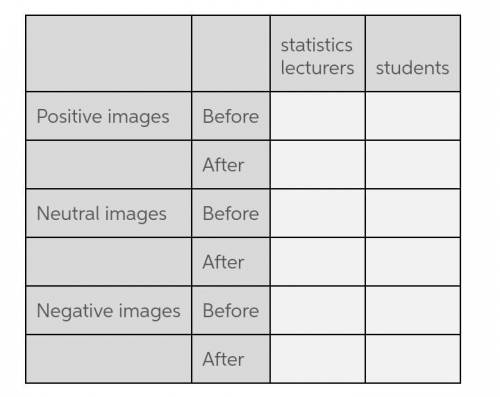
An experiment was done to look at the positive arousing effects of imagery on different people. A sample of statistics lecturers was compared against a group of students. Both groups received presentations of positive images (e. g., cats and bunnies), neutral images (e. g., duvets and light bulbs), and negative images (e. g., corpses and vivisection photographs). Positive arousal was measured physiologically (high values indicate positive arousal) both before and after each batch of images. The order in which participants saw the batches of positive, neutral and negative images was randomized to avoid order effects. It was hypothesized that positive images would increase positive arousal, negative images would reduce positive arousal and that neutral images would have no effect. Differences between the subject groups (lecturers and students) were not expected. What technique should be used to analyse these data? Three-way mixed ANOVA Two-way mixed ANOVA Three-way repeated-measures ANOVA Two-way mixed analysis of covariance

Answers: 1
Another question on Mathematics
Mathematics, 21.06.2019 14:20
Suppose a least-squares regression line is given by modifyingabove y with caret equals 4.302 x minus 3.293. what is the mean value of the response variable if xequals20?
Answers: 3
Mathematics, 21.06.2019 14:50
Eight people were asked what the balance of their savings account at the beginning of the month was and how much it increased or decreased by the end of the month. create a scatter plot that represents the data that is shown in the table. the x-axis represents the beginning balance in thousands of dollars and the y-axis represents the change in the savings account in hundreds of dollars. name beginning balance (in thousands of dollars) change in savings account (in hundreds of dollars) jimmy 5 3 kendra 4 7 carlos 5 4 yolanda 3 1 shawn 2 5 laura 3 2 andy 5 6 georgia 4 3
Answers: 1
Mathematics, 21.06.2019 21:30
In a test for esp (extrasensory perception), the experimenter looks at cards that are hidden from the subject. each card contains either a star, a circle, a wave, a cross or a square.(five shapes) as the experimenter looks at each of 20 cards in turn, the subject names the shape on the card. when the esp study described above discovers a subject whose performance appears to be better than guessing, the study continues at greater length. the experimenter looks at many cards bearing one of five shapes (star, square, circle, wave, and cross) in an order determined by random numbers. the subject cannot see the experimenter as he looks at each card in turn, in order to avoid any possible nonverbal clues. the answers of a subject who does not have esp should be independent observations, each with probability 1/5 of success. we record 1000 attempts. which of the following assumptions must be met in order to solve this problem? it's reasonable to assume normality 0.8(1000), 0.2(1000)%30 approximately normal 0.8(1000), 0.2(1000)% 10 approximately normal srs it is reasonable to assume the total number of cards is over 10,000 it is reasonable to assume the total number of cards is over 1000
Answers: 1
Mathematics, 21.06.2019 21:50
Determine the common ratio and find the next three terms of the geometric sequence. 10, 2, 0.4, a. 0.2; -0.4, -2, -10 c. 0.02; 0.08, 0.016, 0.0032 b. 0.02; -0.4, -2, -10 d. 0.2; 0.08, 0.016, 0.0032 select the best answer from the choices provided a b c d
Answers: 1
You know the right answer?
An experiment was done to look at the positive arousing effects of imagery on different people. A sa...
Questions

Mathematics, 04.11.2019 23:31


Chemistry, 04.11.2019 23:31
Mathematics, 04.11.2019 23:31
Mathematics, 04.11.2019 23:31


Geography, 04.11.2019 23:31

Arts, 04.11.2019 23:31

Social Studies, 04.11.2019 23:31
Mathematics, 04.11.2019 23:31


