Due
<
Practice & Problem Solving
E Question Help
45 PS-8
Reason...

Mathematics, 20.04.2020 22:46 hawszanderpelv2v
Due
<
Practice & Problem Solving
E Question Help
45 PS-8
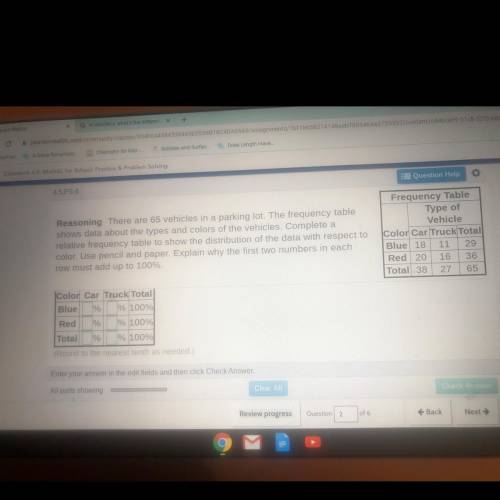
Reasoning There are 65 vehicles in a parking lot. The frequency table
shows data about the types and colors of the vehicles. Complete a
relative frequency table to show the distribution of the data with respect to
color. Use pencil and paper. Explain why the first two numbers in each
row must add up to 100%
Frequency Table
Type of
Vehicle
Color Car Truck Total
Blue 18 11 29
Red 20 16 36
Total 38 27 65
Color Car Truck Total
Blue % % 100%
Red % % 100%
Total % % 100%
(Round to the nearest tenth as needed.)
Enter your answer in the edit fields and then click Check Answer.
All parts showing
Clear A
Review progress
Question
2
Back
Next →

Answers: 2
Another question on Mathematics
Mathematics, 21.06.2019 21:00
Kira looked through online census information to determine the overage number of people living in the homes in her city what is true about kira's data collection?
Answers: 1
Mathematics, 21.06.2019 22:30
The party planning committee has to determine the number of tables needed for an upcoming event. if a square table can fit 8 people and a round table can fit 6 people, the equation 150 = 8x + 6y represents the number of each type of table needed for 150 people.
Answers: 1
Mathematics, 22.06.2019 01:30
Arecent study focused on the number of times men and women who live alone buy take-out dinner in a month. assume that the distributions follow the normal probability distribution and the population standard deviations are equal. the information is summarized below. statistic men women sample mean 24.85 21.33 sample standard deviation 5.54 4.93 sample size 34 36 at the 0.01 significance level, is there a difference in the mean number of times men and women order take-out dinners in a month? state the decision rule for 0.01 significance level: h0: μmen= μwomen h1: μmen ≠ μwomen. (negative amounts should be indicated by a minus sign. round your answers to 3 decimal places.) compute the value of the test statistic. (round your answer to 3 decimal places.) what is your decision regarding the null hypothesis? what is the p-value? (round your answer to 3 decimal places.)
Answers: 1
Mathematics, 22.06.2019 01:30
Jacob is graphing the line represented by the equation −6x−5y=12.−6x−5y=12. he first plots the x-x- and y-interceptsy-intercepts as follows. which statement is correct regarding the intercepts on the graph?
Answers: 1
You know the right answer?
Questions

Geography, 02.10.2019 01:00

Chemistry, 02.10.2019 01:00

Social Studies, 02.10.2019 01:00

English, 02.10.2019 01:00
English, 02.10.2019 01:00

Mathematics, 02.10.2019 01:00
Mathematics, 02.10.2019 01:00

Mathematics, 02.10.2019 01:00

History, 02.10.2019 01:00
Chemistry, 02.10.2019 01:00


