The dot plot shows the number of hours students in the
band practiced their instruments.
...

Mathematics, 20.04.2020 19:52 shjblover812
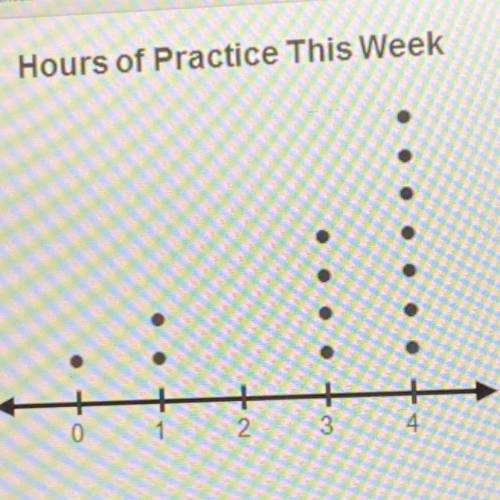
The dot plot shows the number of hours students in the
band practiced their instruments.
Which describe the dot plot? Select all that apply.
There is a cluster from 3 to 4.
There is a gap between 1 and 3.
There is a peak at 4.
The data shows symmetry.
The data is skewed left.
The data is skewed right.

Answers: 1
Another question on Mathematics
Mathematics, 21.06.2019 19:00
Which values of p and q result in an equation with exactly one solution? px-43=-42x+q choose all answers that apply: a) p=-43 and q=-43 b) p=42 and q=43 c) p=43 and q=−42 d) p=42 and q=42
Answers: 1
Mathematics, 21.06.2019 22:00
Find two consexutive odd integers such that the sum of their square is 650
Answers: 2
Mathematics, 21.06.2019 23:00
How many 3-digit numbers can you write using only digits 1 and 7? (of course, digits can repeat.) how many 3-digit numbers can you write using only digits 1 and 7? (of course, digits can repeat.)
Answers: 2
You know the right answer?
Questions


History, 26.06.2019 07:30
Mathematics, 26.06.2019 07:30

Chemistry, 26.06.2019 07:30
History, 26.06.2019 07:30

Mathematics, 26.06.2019 07:30

Advanced Placement (AP), 26.06.2019 07:30


