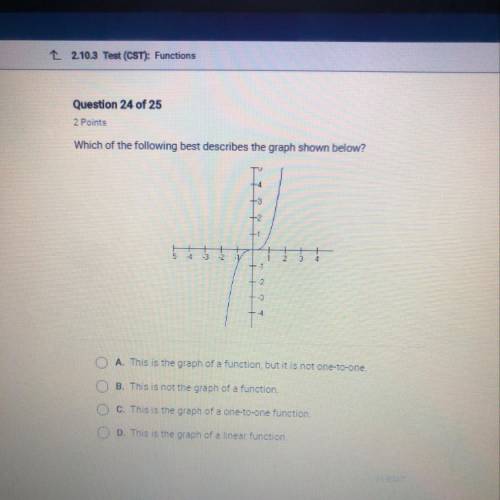
Which of the following best describes the graph shown below?
A. This is the graph of a f...

Mathematics, 18.04.2020 07:52 bvghchg8812
Which of the following best describes the graph shown below?
A. This is the graph of a function, but it is not one-to-one.
O
B. This is not the graph of a function,
O
C. This is the graph of a one-to-one function
O
D. This is the graph of a linear function

Answers: 3
Another question on Mathematics
Mathematics, 21.06.2019 18:40
Valentina is subtracting from . she finds the lcd to be 15y2. what is valentina's next step?
Answers: 2
Mathematics, 21.06.2019 20:30
26) -2(7x) = (-2 • 7) x a. associative property of addition b. associative property of multiplication c. commutative property of multiplication d. commutative property of addition
Answers: 1
Mathematics, 21.06.2019 20:30
A. plot the data for the functions f(x) and g(x) on a grid and connect the points. x -2 -1 0 1 2 f(x) 1/9 1/3 1 3 9 x -2 -1 0 1 2 g(x) -4 -2 0 2 4 b. which function could be described as exponential and which as linear? explain. c. if the functions continue with the same pattern, will the function values ever be equal? if so, give estimates for the value of x that will make the function values equals. if not, explain why the function values will never be equal.
Answers: 3
You know the right answer?
Questions

English, 07.07.2019 06:30

Chemistry, 07.07.2019 06:30
Mathematics, 07.07.2019 06:30
Mathematics, 07.07.2019 06:30
Mathematics, 07.07.2019 06:30
Mathematics, 07.07.2019 06:30

SAT, 07.07.2019 06:30
Mathematics, 07.07.2019 06:30
Mathematics, 07.07.2019 06:30

Biology, 07.07.2019 06:30
Mathematics, 07.07.2019 06:30
Mathematics, 07.07.2019 06:30


