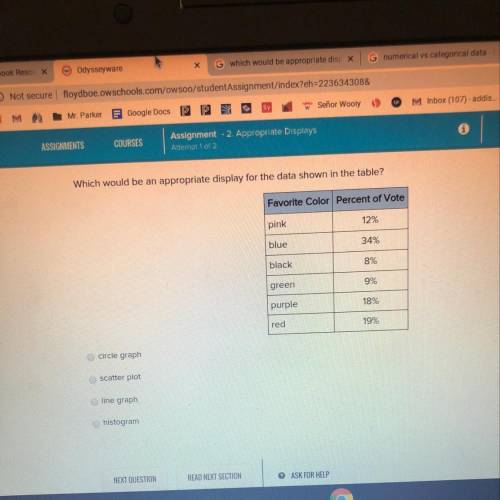
Which would be an appropriate display for the data shown in the table?

Mathematics, 16.04.2020 05:02 moneywaydaedae
Need ASAP will mark
Which would be an appropriate display for the data shown in the table?
Favorite Color Percent of Vote
pink
12%
blue
34%
black
8%
green
9%
purple
18%
red
19%
circle graph
scatter plot
line graph
histogram

Answers: 3
Another question on Mathematics
You know the right answer?
Need ASAP will mark
Which would be an appropriate display for the data shown in the table?
Which would be an appropriate display for the data shown in the table?
Questions

History, 13.10.2020 05:01

Computers and Technology, 13.10.2020 05:01
Mathematics, 13.10.2020 05:01
Mathematics, 13.10.2020 05:01
Mathematics, 13.10.2020 05:01


Physics, 13.10.2020 05:01

Mathematics, 13.10.2020 05:01
History, 13.10.2020 05:01
Mathematics, 13.10.2020 05:01
History, 13.10.2020 05:01
History, 13.10.2020 05:01
English, 13.10.2020 05:01


