(this question is for image number 2)
1.The following dot plot represents a random sampl...

Mathematics, 15.04.2020 17:26 darrengresham999
(this question is for image number 2)
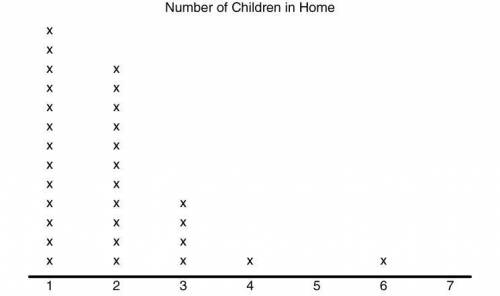
1.The following dot plot represents a random sample of elementary students and the number of children that live in their home.
Part 1: What is the range of the data set?
Part 2: What is the interquartile range of the data set?
Part 3: What is the mean absolute deviation of the data set? [Round both the mean and the mean absolute deviation to the nearest tenth.]
2.The following dot plot represents a random sample of elementary students and the number of children that live in their home.
Calculate the measures of central tendency for this set of data. Which of the following statements is NOT true?
a. The mean is closer in value to the mode than to the median.
b. The median is the largest measure of central tendency.
c. The median is greater than the mode.
d. The mode is less than the mean.
(questions for image 1)
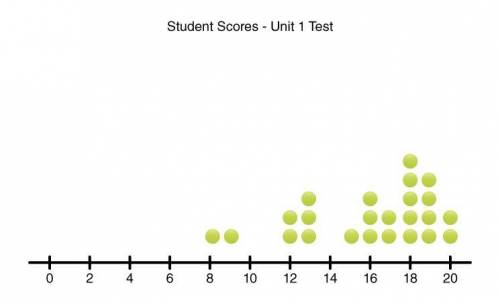
1.The following dot plot represents student scores on the Unit 1 math test. Scores are in whole number increments. If the test was out of 20 points, about what percentage of the students scored at least 80% on the test?
a.48%
b.67%
c.17%
d.12%
2.The following dot plot represents student scores on the Unit 1 math test. Scores are in whole number increments.
Part 1: What is the mean score, rounded to the nearest whole number?
Part 2: What is the median score?
Part 3: What is the mode score?
3.The following dot plot represents student scores on the Unit 1 math test. Scores are in whole number increments.
For this data set, the value of the range is about(CHOOSE: the same as or triple, or twice) the value of the interquartile range.
On average, the data points lie between(CHOOSE: 3 and 4 or 5 and 6 or 1 and 2 or 2 and 3 or 4 and 5) points from the mean.
HELP MEH ASAP

Answers: 1
Another question on Mathematics
Mathematics, 21.06.2019 16:40
Ajar contains a mixture of 20 black marbles, 16 red marbles, and 4 white marbles, all the same size. find the probability of drawing a white or red marble on the first draw. 125 12 01 next question ask for turn it in
Answers: 2
Mathematics, 21.06.2019 23:30
Adele is five years older than timothy. in three years, timothy will be 2/3 of adele’s age. what is adele‘s current age?
Answers: 1
Mathematics, 22.06.2019 00:30
Jennifer taking a quiz and has answered 13 questions so far. if there are 25 questions on jennifer test, how many questions does she have left to answer
Answers: 1
You know the right answer?
Questions

Chemistry, 04.01.2021 17:20
Chemistry, 04.01.2021 17:20

English, 04.01.2021 17:20

Law, 04.01.2021 17:20
Mathematics, 04.01.2021 17:20
Chemistry, 04.01.2021 17:20

Mathematics, 04.01.2021 17:20

Mathematics, 04.01.2021 17:20
Law, 04.01.2021 17:20
English, 04.01.2021 17:20


