 ) = 64 and a standard deviation (
 ) =
) = 
 but μ=64 and σ=19 and n=14,
  and
and 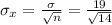
A simple random sample of size n=14 is obtained from a population with μ=64 and σ=19.
(a...

Mathematics, 15.04.2020 03:31 ashleyrover11
A simple random sample of size n=14 is obtained from a population with μ=64 and σ=19.
(a) What must be true regarding the distribution of the population in order to use the normal model to compute probabilities involving the sample mean? Assuming that this condition is true, describe the sampling distribution of overbarx.
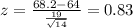
(b) Assuming the normal model can be used, determineP(overbar x < 68.2).
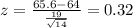
(c) Assuming the normal model can be used, determineP(overbar x ≥ 65.6).
(a) What must be true requarding the distribution of the population?
A. The population must be normally distributed.
B. The sampling distribution must be assumed to be normal.
C. Since the sample size is large enough, the population distribution does not need to be normal.
D. The population must be normally distributed and the sample size must be large.

Answers: 2
Another question on Mathematics
Mathematics, 21.06.2019 15:00
Translate the word phrase into a math expression. 15 fewer than the product of 4 and a number. (pls immediately)
Answers: 2
Mathematics, 21.06.2019 18:50
The first few steps in solving the quadratic equation 9x2 + 49x = 22 ? 5x by completing the square are shown. 9x2 + 49x = 22 ? 5x 9x2 + 54x = 22 9(x2 + 6x) = 22 which is the best step to do next to solve the equation by completing the square? 9(x2 + 6x + 3) = 25 9(x2 + 6x + 3) = 49 9(x2 + 6x + 9) = 31 9(x2 + 6x + 9) = 103
Answers: 3
Mathematics, 22.06.2019 01:00
The weight of 46 new patients of a clinic from the year 2018 are recorded and listed below. construct a frequency distribution, using 7 classes. then, draw a histogram, a frequency polygon, and an ogive for the data, using the relative information from the frequency table for each of the graphs. describe the shape of the histogram. data set: 130 192 145 97 100 122 210 132 107 95 210 128 193 208 118 196 130 178 187 240 90 126 98 194 115 212 110 225 187 133 220 218 110 104 201 120 183 124 261 270 108 160 203 210 191 180 1) complete the frequency distribution table below (add as many rows as needed): - class limits - class boundaries - midpoint - frequency - cumulative frequency 2) histogram 3) frequency polygon 4) ogive
Answers: 1
You know the right answer?
Questions

Mathematics, 01.04.2021 09:20
Mathematics, 01.04.2021 09:20
Mathematics, 01.04.2021 09:20

History, 01.04.2021 09:20
Mathematics, 01.04.2021 09:20

Physics, 01.04.2021 09:20
English, 01.04.2021 09:20
Mathematics, 01.04.2021 09:20
English, 01.04.2021 09:20


Social Studies, 01.04.2021 09:20


