
Mathematics, 15.04.2020 01:32 tybtookie
A random sample of 180 microbiology students were asked how many science classes he or she was enrolled in August 1990. The results showed a mean of 1.83 science classes with a standard deviation of 1.48. Fifteen years later, a similar survey was conducted to determine if the distribution changed. The 2005 sample mean was 1.94 with a standard deviation of 1.62. Do the data provide statistical evidence that the mean number of science classes taken in the first survey is different from the survey taken 15 years later? Perform the appropriate test using α = 0.05.

Answers: 2
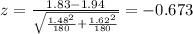

 we see that
  so we can conclude that we FAIL to reject the null hypothesis, and a would NOT be a significant difference in the two means
 represent the mean in 1990
 represent the mean for 2005
 represent the sample deviation for 1990
 represent the sample standard deviation for 2005
 sample size for 1990
 sample size for 2005

 (1)
(1)
Another question on Mathematics
Mathematics, 21.06.2019 19:00
Me with geometry ! in this figure, bc is a perpendicular bisects of kj. dm is the angle bisects of bdj. what is the measure of bdm? •60° •90° •30° •45°
Answers: 2
Mathematics, 21.06.2019 21:00
Campus rentals rents 2 and 3 bedrooms apartments for $700 ans $900 a month respectively. last month they had six vacant apartments and reported $4600 in lost rent. how many of each type of apartment were vacant?
Answers: 1
Mathematics, 21.06.2019 21:30
The box plots show the average speeds, in miles per hour, for the race cars in two different races. which correctly describes the consistency of the speeds of the cars in the two races?
Answers: 3
You know the right answer?
A random sample of 180 microbiology students were asked how many science classes he or she was enrol...
Questions
Mathematics, 06.05.2020 04:16

Geography, 06.05.2020 04:16


History, 06.05.2020 04:16
Mathematics, 06.05.2020 04:16

Spanish, 06.05.2020 04:16
Mathematics, 06.05.2020 04:16
Mathematics, 06.05.2020 04:16

Social Studies, 06.05.2020 04:16

Mathematics, 06.05.2020 04:16


