
Mathematics, 14.04.2020 18:55 jaida03
The table showing the stock price changes for a sample of 12 companies on a day is contained in the Excel file below.
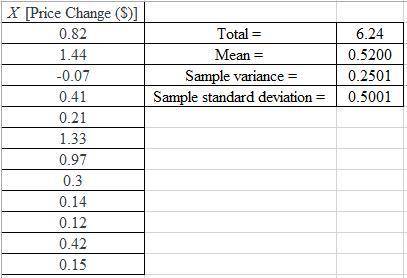
Price Change ($)
0.82
1.44
-0.07
0.41
0.21
1.33
0.97
0.30
0.14
0.12
0.42
0.15
Construct a spreadsheet to answer the following questions.
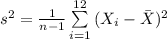
a. Compute the sample variance for the daily price change (to 4 decimals).
b. Compute the sample standard deviation for the price change (to 4 decimals).
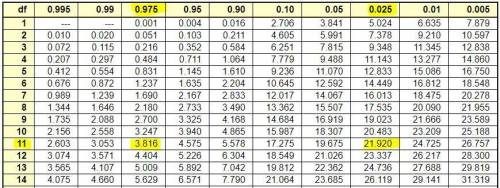
c. Provide 95% confidence interval estimates of the population variance (to 4 decimals).

Answers: 1

 =AVERAGE(A2:A13)
 =VAR.S(A2:A13)
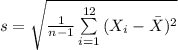
 =STDEV.S(A2:A13)
![CI=[\frac{(n-1)s^{2}}{\chi^{2}_{\alpha/2} } \leq \sigma^{2}\leq \frac{(n-1)s^{2}}{\chi^{2}_{1-\alpha/2} } ]](/tpl/images/0598/7478/a42f6.png)


![=[\frac{(12-1)\times 0.2501}{21.920 } \leq \sigma^{2}\leq \frac{(12-1)\times 0.2501}{3.816} ]](/tpl/images/0598/7478/f887c.png)
![=[0.125506\leq \sigma^{2}\leq 0.720938]\\\approx [0.1255, 0.7210]](/tpl/images/0598/7478/e0a86.png)
Another question on Mathematics
Mathematics, 21.06.2019 15:00
7(x - 2) = 3(x + 4) solve the following equation. then enter your answer in the space provided using mixed number format.
Answers: 2
Mathematics, 21.06.2019 17:30
Asphere has a diameter of 10 in. what is the volume of the sphere?
Answers: 1
Mathematics, 21.06.2019 18:00
Me asap! what is the slope of this line? enter your answer in the box.
Answers: 2
Mathematics, 21.06.2019 19:00
The fence around a quadrilateral-shaped pasture is 3a^2+15a+9 long. three sides of the fence have the following lengths: 5a, 10a-2, a^2-7. what is the length of the fourth side of the fence?
Answers: 1
You know the right answer?
The table showing the stock price changes for a sample of 12 companies on a day is contained in the...
Questions


History, 16.04.2020 19:13

Mathematics, 16.04.2020 19:13
Mathematics, 16.04.2020 19:13

Spanish, 16.04.2020 19:13

Chemistry, 16.04.2020 19:13

Geography, 16.04.2020 19:13


