Barney is an ecologist who studies the change in the tiger population of Siberia over time.
Th...

Mathematics, 04.04.2020 17:09 studybug779
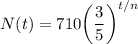
Barney is an ecologist who studies the change in the tiger population of Siberia over time.
The relationship between the elapsed time t, in decades, since Barney started studying the population, and the
number of tigers, N(t), is modeled by the following function:
N() = 710 (35)
Complete the following sentence about the rate of change in the tiger population. Round your answer to two
decimal places.
The tiger population loses
3/5
of its size every decades

Answers: 2
Another question on Mathematics
Mathematics, 21.06.2019 13:00
20+ ! come and answer quick! triangle mno is reflected over the x-axis and then translated up 4 and right 3. how can the transformation be amended such that the translation can occur before the reflection and have the image remain in the same position? a translate the pre-image down 4 and right 3 and then reflect the figure over the x-axis. b translate the pre-image up 3 and right 4 and then reflect the figure over the x-axis. c translate the pre-image up 4 and left 3 and then reflect the figure over the y-axis. d translate the pre-image down 3 and right 4 and then reflect the figure over the x-axis.
Answers: 2
Mathematics, 21.06.2019 16:30
The equation of a circle is (x - 3)2 + (y - 7)2 = 25. determine the length of the radius. 4 25 12.5 5 write the standard equation of the circle with center (2, 3) and a diameter of 12. (x - 2)2 + (y - 3)2 = 36 (x + 2)2 + (y + 3)2 = 12 (x - 2)2 + (y - 3)2 = 6 (x - 3)2 + (y - 2)2 = 36 the equation of a circle is (x + 3)2 + (y + 7)2 = 25. where is (3, 4) located in relation to the circle? on the circle in the interior of the circle in the exterior of the circle at the center of the circle
Answers: 1
Mathematics, 21.06.2019 18:00
When lulu enlarged her drawing of a rabbit, the enlarged picture appeared to be distorted. which statement about the transformation applied to her drawing is true?
Answers: 2
Mathematics, 21.06.2019 20:00
Someone answer asap for ! max recorded the heights of 500 male humans. he found that the heights were normally distributed around a mean of 177 centimeters. which statements about max’s data must be true? a. the median of max’s data is 250 b. more than half of the data points max recorded were 177 centimeters. c. a data point chosen at random is as likely to be above the mean as it is to be below the mean. d. every height within three standard deviations of the mean is equally likely to be chosen if a data point is selected at random.
Answers: 1
You know the right answer?
Questions
Mathematics, 19.05.2021 03:30

English, 19.05.2021 03:30

Arts, 19.05.2021 03:30

Mathematics, 19.05.2021 03:30
Mathematics, 19.05.2021 03:30
Mathematics, 19.05.2021 03:30
Mathematics, 19.05.2021 03:30
Mathematics, 19.05.2021 03:30

Biology, 19.05.2021 03:30
Mathematics, 19.05.2021 03:30


Spanish, 19.05.2021 03:30


