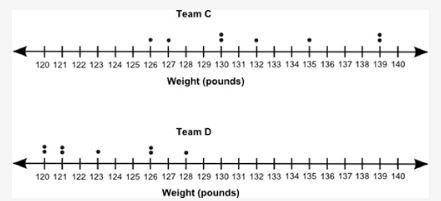
The dot plots below show the weights of the players of two teams:
Two dot plots are show...

Mathematics, 02.04.2020 23:31 mayfieldashley2437
The dot plots below show the weights of the players of two teams:
Two dot plots are shown one below the other. The top and the bottom plots have the title Team C and Team D respectively. Below the line for each dot plot is written Weight followed by pounds in parentheses. The markings on each line are from 120 till 140 at intervals of 1. For the top plot there are 2 dots each for 130 and 139 and 1 dot each for 126, 127, 132, and 135. For the bottom plot there are two dots each for 120, 121 and 126 and 1 dot each for 123, and 128.
Based on visual inspection of the dot plots, which team appears to have the larger mean weight?
Both groups are similar.
Team C
Team D

Answers: 1
Another question on Mathematics
Mathematics, 21.06.2019 15:10
5.(04.07) two different plants grow each year at different rates, which are represented by the functions f(x) = 4* and g(x) = 5x + 2. what is the first year the f(x) height is greater than the g(x) height? year 3 year 0 year 2 year 1
Answers: 1
Mathematics, 21.06.2019 19:10
1jessica's home town is a mid-sized city experiencing a decline in population. the following graph models the estimated population if the decline continues at the same rate. select the most appropriate unit for the measure of time that the graph represents. a. years b. hours c. days d. weeks
Answers: 2
Mathematics, 21.06.2019 22:00
If x+y+z=0 what is the value of [tex] {x}^{3} + {y}^{3} + {z}^{3} [/tex]
Answers: 2
You know the right answer?
Questions
Mathematics, 13.10.2019 14:30

Social Studies, 13.10.2019 14:30
Mathematics, 13.10.2019 14:30
Mathematics, 13.10.2019 14:30
Mathematics, 13.10.2019 14:30

English, 13.10.2019 14:30

History, 13.10.2019 14:30

English, 13.10.2019 14:30

Health, 13.10.2019 14:30
English, 13.10.2019 14:30
Mathematics, 13.10.2019 14:30

English, 13.10.2019 14:30
History, 13.10.2019 14:30

Computers and Technology, 13.10.2019 14:30
Mathematics, 13.10.2019 14:30


