
Mathematics, 01.04.2020 21:58 jaden2058
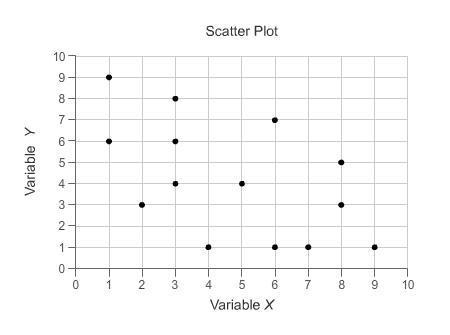
The scatter plot shows the annual earnings and tenures of a few employees of Stan & Earl Corp.
The regression line for this data set has a slope close to m = (see box 1) , and the correlation coefficient is close to (see box 2).
Based on this information, we can conclude that employees’ annual earnings are (see box 3) to their tenure. Employee earnings (see box 4) tenure.
Box 1:
A. m= 5.5
B. m= 35
C. m= -50
D. m= 2.5
Box 2:
A. 0.20
B. 0.40
C. 0.75
D. 0.95
Box 3.
A. strongly related
B. moderately related
C. weakly related
D. not related
Box 4:
A. increase with
B. decrease with
C. are not affected by

Answers: 3
Another question on Mathematics
Mathematics, 21.06.2019 17:00
The perimeter of a movie screen is 54 meters. the screen is 18 meters wide. how tall is it?
Answers: 1
Mathematics, 22.06.2019 00:00
Which of the following will form the composite function?
Answers: 1
Mathematics, 22.06.2019 01:00
70 points ! pls 2. given the following two sets of data what is the union of the two sets and what is the intersection of the two sets. set a = {1, 2, 3, 4, 5, 6, 7, 8, 9} set b = {2, 4, 6, 8, 10, 12, 14} 3. given a regular deck of cards. describe a way of pulling cards that would create a dependent event and then one that would create an independent event. 4. what is the probability of drawing a red card and then drawing a spade without replacing the card that was drawn first?
Answers: 1
You know the right answer?
The scatter plot shows the annual earnings and tenures of a few employees of Stan & Earl Corp.
Questions

Chemistry, 10.04.2020 02:07

Computers and Technology, 10.04.2020 02:07


History, 10.04.2020 02:07

Mathematics, 10.04.2020 02:08
Biology, 10.04.2020 02:09
Mathematics, 10.04.2020 02:23
Mathematics, 10.04.2020 02:23
Mathematics, 10.04.2020 02:23
History, 10.04.2020 02:23


